Annual Review - Piramal Enterprises 2019
In last four years, the business mix of Piramal Enterprises has changed completely
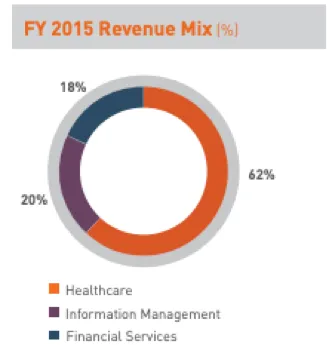
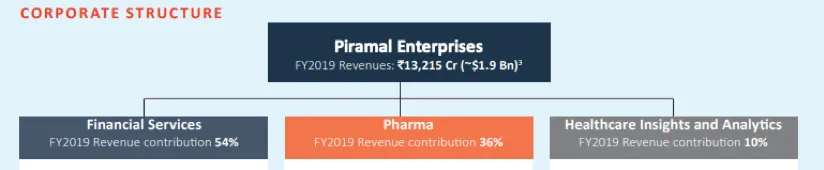
With financial services forming lion share of top line and bottom line.
Right from start, the decision to invest in Piramal Enterprises (as well as Thomas Cook) was to ride with smart managers who have a fantastic long term record of creating wealth.
Coming to FY19 business performance
Financial Services
The NBFC sector was impacted by a liquidity tightening situation, triggered by default by IL&FS and further worsened with defaults by large corporate groups like ADAG and ZEE. The adverse environment led to reducing the growth loan book grew 34% y-o-y to ₹56,624 crores. For any financial services company, it’s easy to expand loan book however the key is to maintain quality of loan book and ensuring there is no Asset-Liability mismatch. On both fronts, till now Piramal has done well. The NPA has been below 1% and across time zones the company has sufficient liquidity to match outflows. At the company level, they have diversified their book from wholesale lending to retail lending which is now 71% of their book compared to 83% in FY 2015. The management indicated that this further improve in the coming years. Housing Finance accounts for 9% of the overall loan book as of March 2019; expected to increase to 15% by March 2020. The cost of borrowing has increased consistently for them in the last 4 quarters, some of it has been passed on to borrowers but the net interest margin has dropped to 5.7% in Q1FY20 from 6.4% at Q4 FY19
Investments in Shriram capital would be exited, In the first quarter of this year, the investment in Shriram Transport finance was sold for a poor 40% return over 5 years. This was clearly a case of capital misallocation in hindsight.
The management did an interesting comparison on a few parameters with leading banks and NBFCs in their annual report
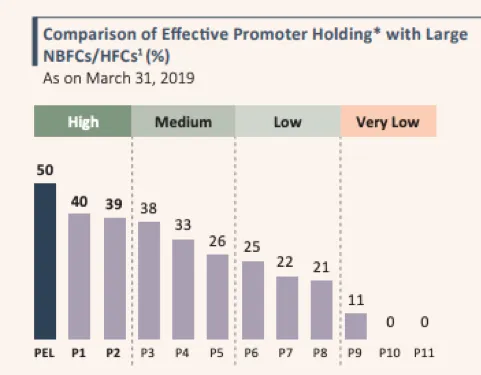
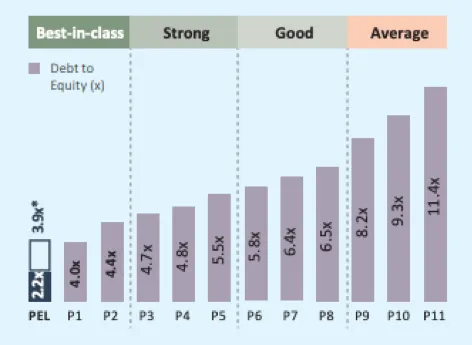
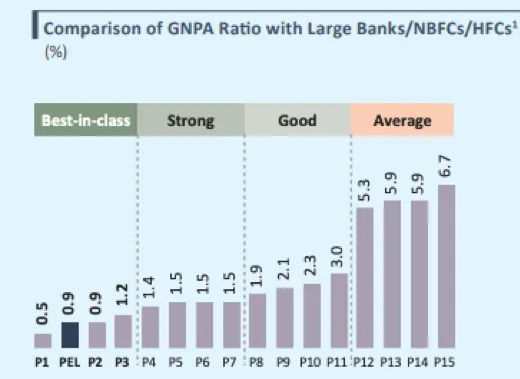
The comparison indicates management’s confidence in its financial services business. We should expect a slow down in financial services some of its already reflected in stock price.
What’s worry?
In Q4FY19 - quarter has shown an increase in the stage 2 assets (30-90 days overdue) from 381 Crs to 838 Crs which is a substantial increase. Stage 3 or NPA have increased to 0.9%. As an offset, the company has provisioning of 1.93% and a 224% provision coverage ratio. Although the management is confident that they will be able to cure most of these accounts based on the plans shared in the presentation, we have to see it in the next few quarters
Can it drown the company?
No, Imagine even if 10% of their real estate book goes bad ~ INR 4,000 crores, they have collateral worth ~16000 crores to sell and recover. Plus management is sounding confident to tide over this crisis in all its analyst calls.
Pharma
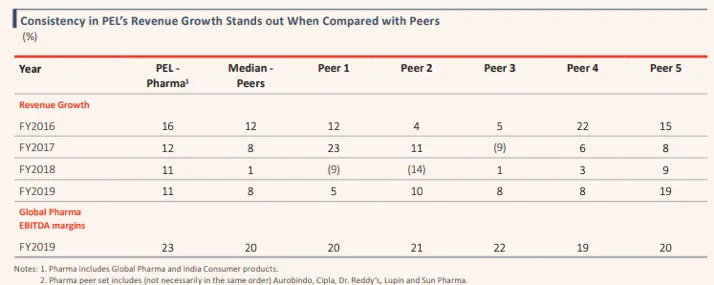
Revenue from the Pharma business grew by 11% y-o-y in FY2019 to ₹4,786 Crores on account of growth in the base business, integration of acquired products into the sales force, strong order book and robust demand. The management expects to grow this business at 10-12% organically with improved profitability due to economies of scale
In the annual report, there was another interesting peer analysis with top Indian pharma companies
HEALTHCARE INSIGHTS & ANALYTICS
For FY2019, revenue from Healthcare Insights & Analytics business stood at ₹1,332 Crores, up 10% y-o-y from ₹1,209 Crores in FY2018. Revenue growth was primarily driven by strong growth in Life Sciences Data & Analytics and Consulting Services. The management expects similar growth with improved profitability as more employees are hired and work is done from India. For this segement, management has done a great job of turning around operations and making it profitable
Valuations
I think of valuations as below
Conservatively pharma business at 10 times bottom line would be ~ INR 5000 crores
Healthcare & Analytics at 1-time slump sale basis would be ~ INR 2000 Crores
The current market cap is ~INR 34000 crores values financial services which are still growing at 15-18% at ~27000 Crores or 1.2-time book inline with a lot of other players in the financial services business
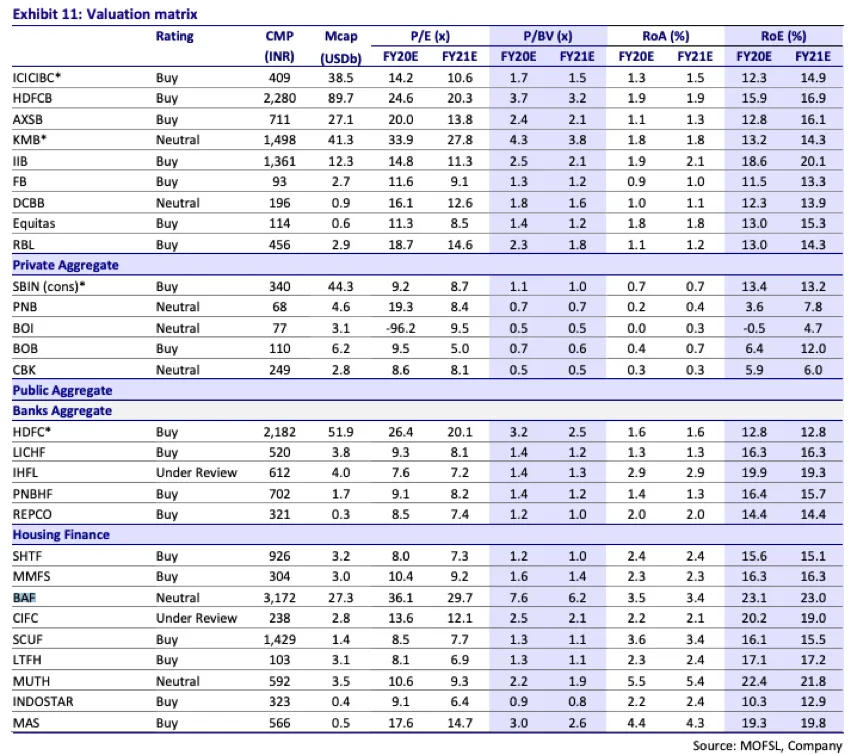
Management thinks its best in class (aka HDFC, Bajaj, Kotak) pedigree current valuations don’t agree with their assessment. Piramal for me already is yielding ~5% dividend (and growing) It’s in pole position in terms of portfolio. I would wait and watch management tide over this situation and may add below 25K crore m-cap
This is a record of the author's thinking in August 2019, kept as written. It is not a recommendation to buy or sell, and the author may hold the securities discussed. See the disclosures.