Akums Drugs
To understand Akums, one must first understand why pharmaceutical companies outsource manufacturing at all. Making medicine is not simply chemistry it is chemistry under surveillance. Every batch must be reproducible. Every facility must satisfy inspectors from the WHO, the US NSF, the European GMP, the UK MHRA, and India’s CDSCO. Every tablet must dissolve at precisely the right rate. Every vial must be sterile, stable, and correctly dosed. This compliance infrastructure costs hundreds of crores to build and years to certify.
Smaller pharmaceutical companies and even large ones pursuing asset-light strategies increasingly find it rational to outsource this complexity to specialists who have already made the investment. Akums is that specialist, at scale. The company operates 14 state-of-the-art manufacturing facilities, producing an extraordinary range of 60+ dosage forms: tablets, capsules, liquid orals, vials, ampoules, blow-filled seals, topical preparations, eye drops, dry powder injections, gummies, and nasal sprays. Its cumulative CDMO formulation capacity stands at 49.6 billion units annually.
Akums operates across three revenue segments. First, the CDMO business the core which contributes approximately 78% of group revenue. Here, Akums manufactures formulations for over 1,400 clients, including 26 of the Top 30 Indian pharmaceutical companies by sales. The client relationship is deeply embedded: once a product is qualified at an Akums facility, switching requires regulatory re-filing and re-audit, creating natural stickiness. Second, the branded formulations business, run through subsidiaries Akumentis (India) and Unosource (70+ export countries), which sells Akums’ own branded and generic products. Third, the API (Active Pharmaceutical Ingredients) business, which manufactures key starting materials primarily cephalosporins and is currently loss-making due to price erosion, but strategically positioned as a supply chain hedge.
A defining characteristic of Akums’ position is the breadth of its intellectual property in manufacturing processes. The company has commercialised 4,146 formulations across 60+ dosage forms since inception. This library of manufacturing know-how, built over 20 years, is not easily replicated.
The Industry: Four Secular Growth Vectors
Vector 1: The Asset-Light Pharma Revolution
The most powerful structural driver for Akums is the irreversible shift in pharmaceutical business models. Global pharmaceutical companies under relentless pressure to improve return on capital are divesting manufacturing assets and concentrating on R&D, marketing, and regulatory affairs. This is not a cyclical trend. It is a permanent restructuring of how medicine is made. India’s domestic CDMO market, valued at approximately USD 1.4 billion in FY24, is projected to reach USD 2.8 billion by FY28 a 14.3% compound annual growth rate. This is nearly double the CAGR of the prior historical period, driven by an accelerating outsourcing wave from both domestic and multinational pharma companies operating in India.
Vector 2: India’s Chronic Disease Burden
India’s pharmaceutical market is being structurally reshaped by the rise of chronic diseases. Cardiovascular, diabetes, oncology, and CNS conditions now affect hundreds of millions of Indians. Chronic therapy prescriptions unlike acute (one-time) medications require lifelong refills. This creates a recurring, predictable demand for the formulations Akums manufactures. Hypertension and diabetes alone account for 68% of all chronic diseases in India’s elderly population. As this cohort grows projected to reach 158.7 million by 2025 the demand for medicines Akums makes will compound quietly and relentlessly.
Vector 3: China+1 API Sourcing Shift
The COVID pandemic exposed the vulnerability of global pharmaceutical supply chains concentrated in China. Regulatory agencies, pharma companies, and governments alike have since pursued deliberate diversification. India with its established chemistry capabilities, lower costs, and improving regulatory credentials is the primary beneficiary. India’s share in global small-molecule API procurement has risen from 6% in FY23 to 9% in FY25, at the direct expense of China’s 46% to 38% decline. Akums’ API business, though currently loss-making due to Cephalosporin price pressures, is strategically positioned to ride this long-term wave as it restructures toward higher-margin complex APIs.
Vector 4: Global CDMO Expansion The European Milestone
Perhaps the most important strategic development in Akums’ recent history is the landmark €200 million contract signed with a leading global pharmaceutical company for the manufacture and supply of pharmaceutical formulations to regulated European markets. This contract, with an annual run rate of EUR 35 million until December 2032, is not merely a revenue milestone it is a proof point. It demonstrates that Akums has achieved the quality standards and operational reliability required by the most demanding pharma markets in the world. It opens the door to subsequent European CDMO contracts. EU-GMP certification for two Akums plants including the oral liquids facility validates this ambition. Commercial supplies to Europe have already commenced from Plant 1 in FY26.
The Moat: Three Layers of Competitive Advantage
Charlie Munger’s concept of a “moat” a sustainable competitive advantage that protects returns from competitive erosion is best evaluated not through adjectives but through specifics. What specifically prevents a competitor from taking Akums’ clients? The answer has three layers.
Layer 1 Production Advantages
Akums has 14 manufacturing facilities with an aggregate CDMO capacity of 49.6 billion units per annum running at approximately 40% utilisation. This underutilisation often presented as a problem is actually Akums’ most compelling financial characteristic. When utilisation rises from 40% to 60%, the marginal cost of that additional revenue is extremely low (most fixed costs are already committed). EBITDA margins expand dramatically. The journey from 40% to 60% utilisation does not require another rupee of major capex it only requires more client orders. This operating leverage is the heart of the bull case.
The breadth of 60+ dosage forms means Akums can serve a client across their entire product portfolio tablets, liquids, injectables, gummies from a single manufacturing partner. This end-to-end capability, combined with WHO-GMP and EU-GMP certifications, makes Akums a one-stop shop that is expensive to replace.
Layer 2 Customer Advantages (Switching Costs)
Once a product is developed, validated, and approved at an Akums facility, the cost of switching manufacturers is substantial. The new facility must be re-qualified. Regulatory dossiers must be re-filed (CDSCO approval can take 12–24 months). Client auditors must inspect the new site. During this transition, the pharma company risks stock-outs. The result is that clients rarely switch CDMO partners for cost reasons alone the switching cost exceeds any savings from a cheaper competitor. This is evidenced by repeat business: 38 of Akums’ top 50 clients (by revenue) have reordered across five consecutive years. That is client stickiness in practice.
Layer 3 Regulatory Advantages
WHO-GMP, EU-GMP (two facilities), UK MHRA, and US NSF certifications are regulatory moats. They took years to obtain and cannot be acquired overnight by a competitor. The DSIR accreditation for the Barwala R&D facility adds another dimension government recognition of R&D capability that unlocks weighted deduction benefits and signals scientific credibility to global clients. 973 DCGI approvals and 117 FSSAI approvals in FY25 alone reflect the pace at which Akums is widening this regulatory moat.
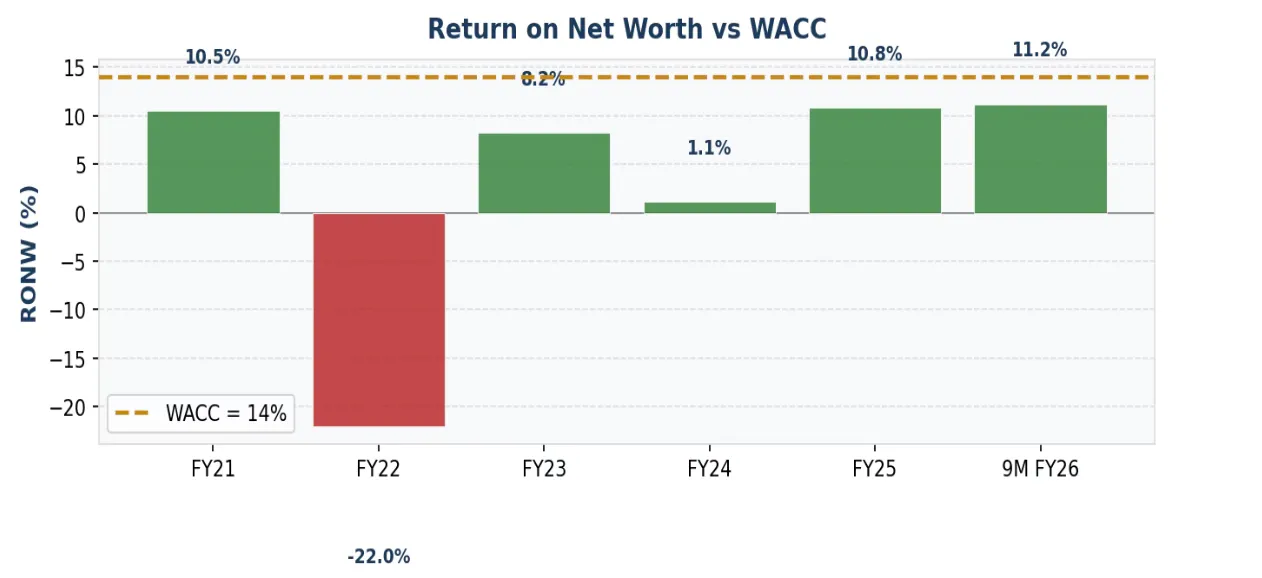
Honest moat verdict: Akums has a narrow-to-medium moat that is actively widening. The moat is real scale, breadth, switching costs, and regulatory certifications are genuine barriers. But pricing power is constrained by large buyer concentration and commodity API inputs. RONW below WACC (10.8% vs 14%) means the moat has not yet translated into excess economic returns. The next three years injectable ramp-up, European contract revenue, API breakeven are the moat-proving years.
The Management: Skin in the Game and Capital Allocation
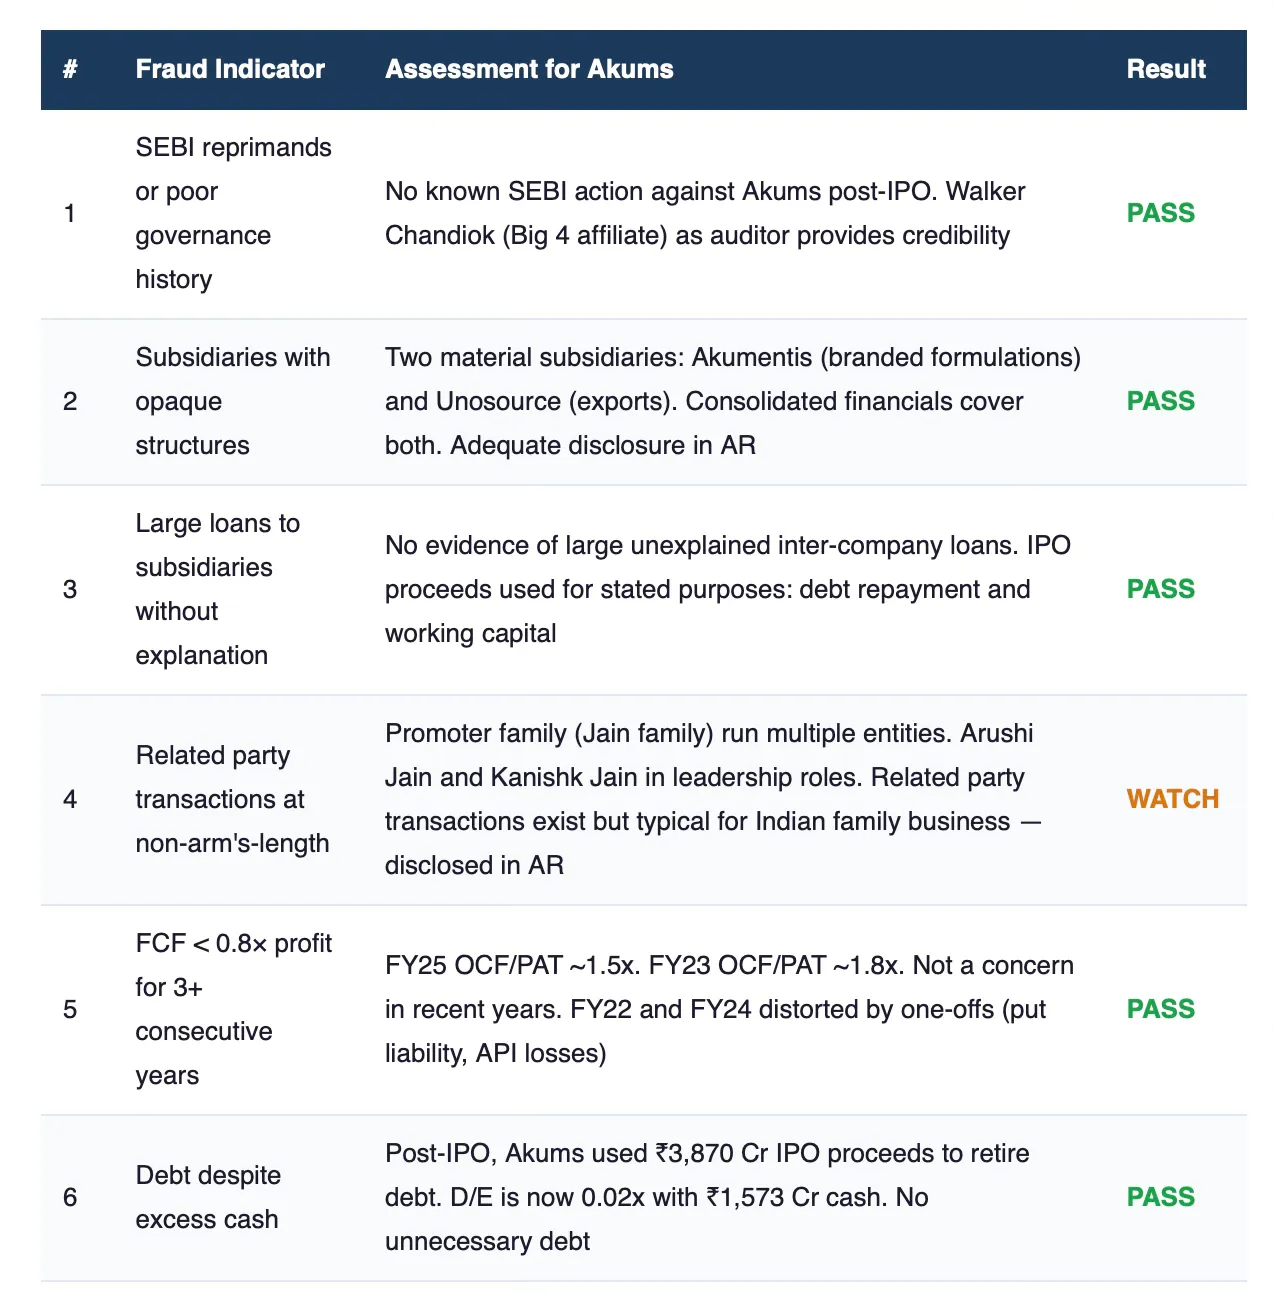
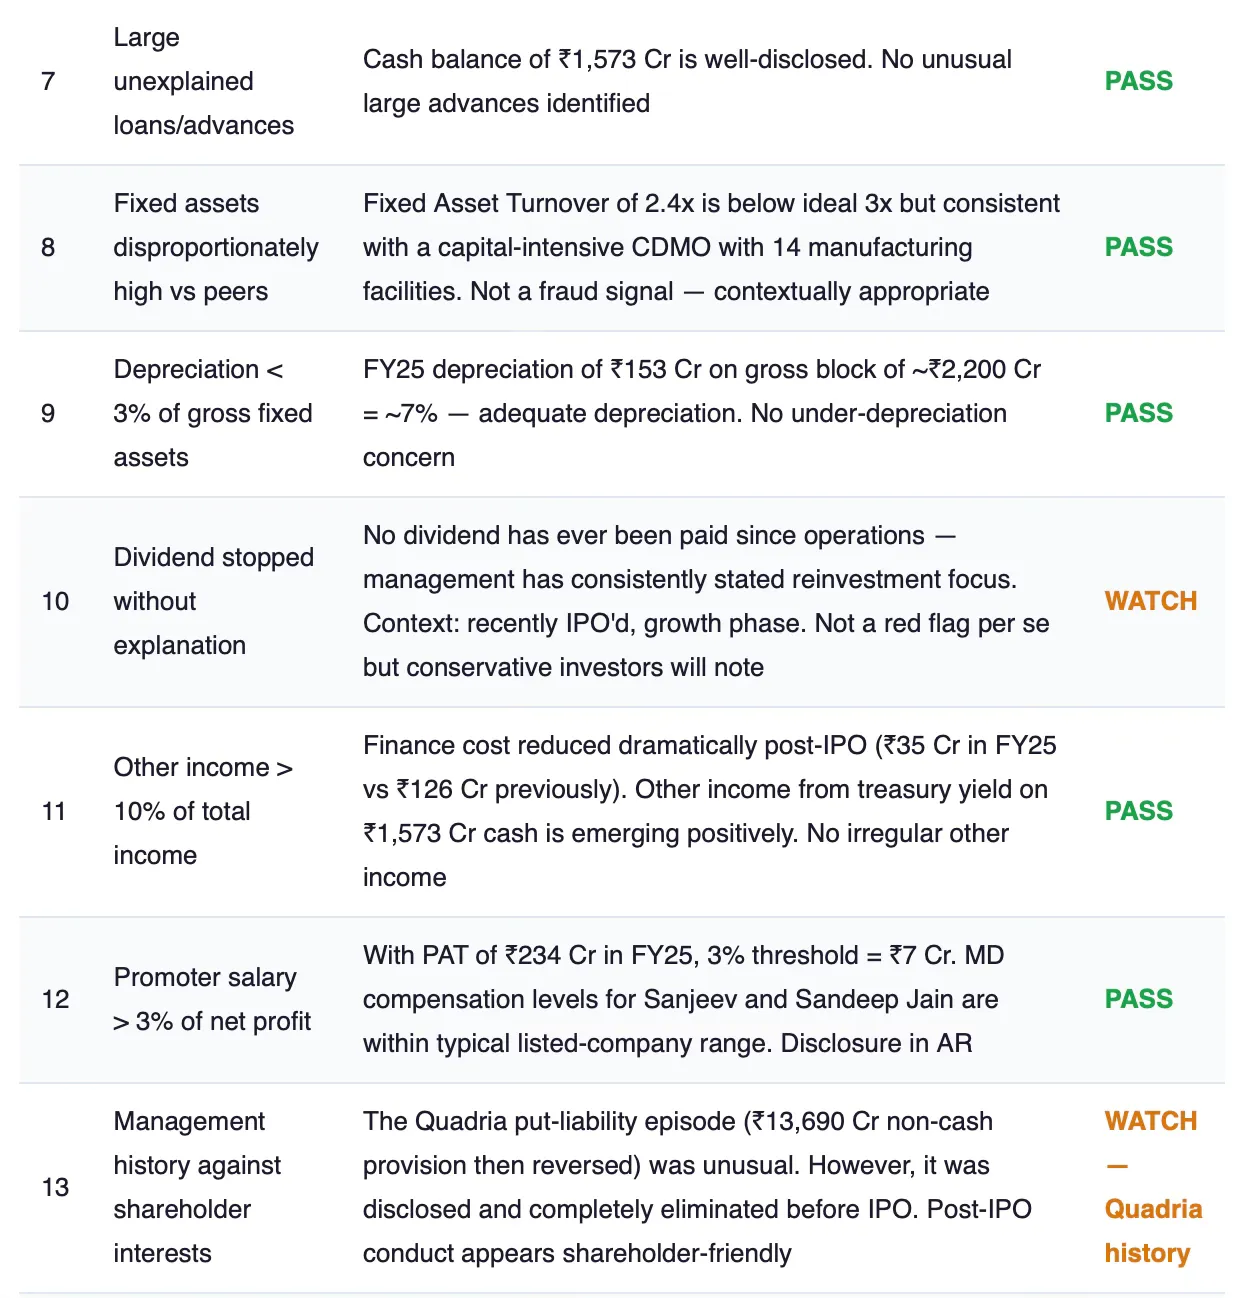
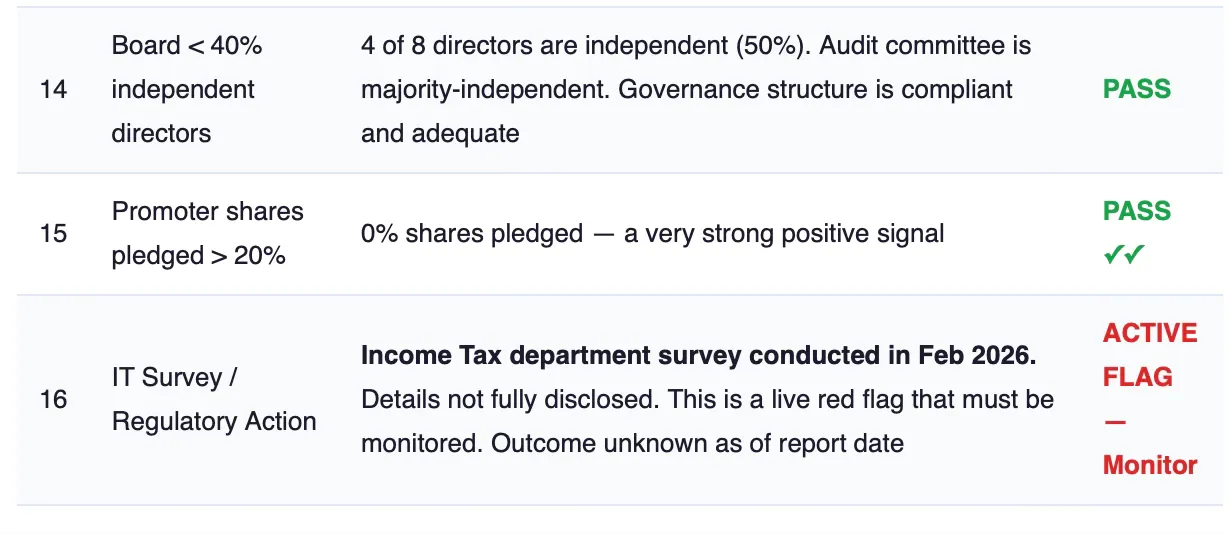
Sanjeev Jain and Sandeep Jain, the co-founders and co-Managing Directors, built Akums from zero in 2004. They own approximately 75.3% of the company post-IPO an unusually high promoter holding that signals conviction in the long-term story. Critically, zero percent of their shares are pledged. In India’s corporate landscape, promoter pledge is a red flag that has preceded many value destructions. Its absence here is a strong positive.
The next generation is already embedded in operations. Arushi Jain serves as Director Corporate Growth and Excellence, and Kanishk Jain as Director Operations Marketing at Akumentis. This succession planning, while normal for family businesses, introduces the usual question of whether next-generation leadership will maintain founder-level hunger and discipline.
The Financials: What the Numbers Say
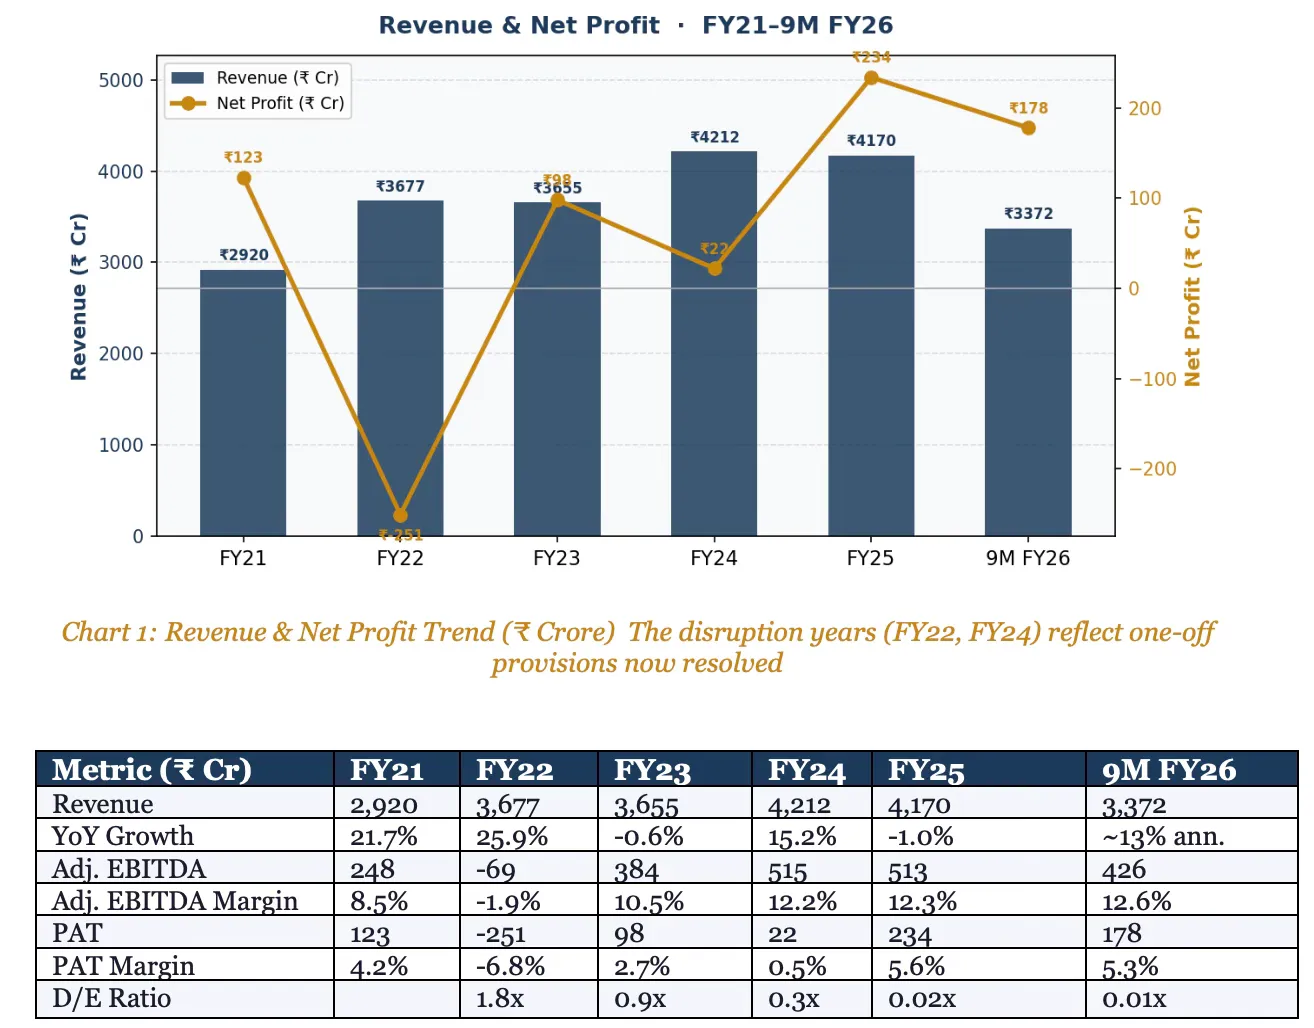
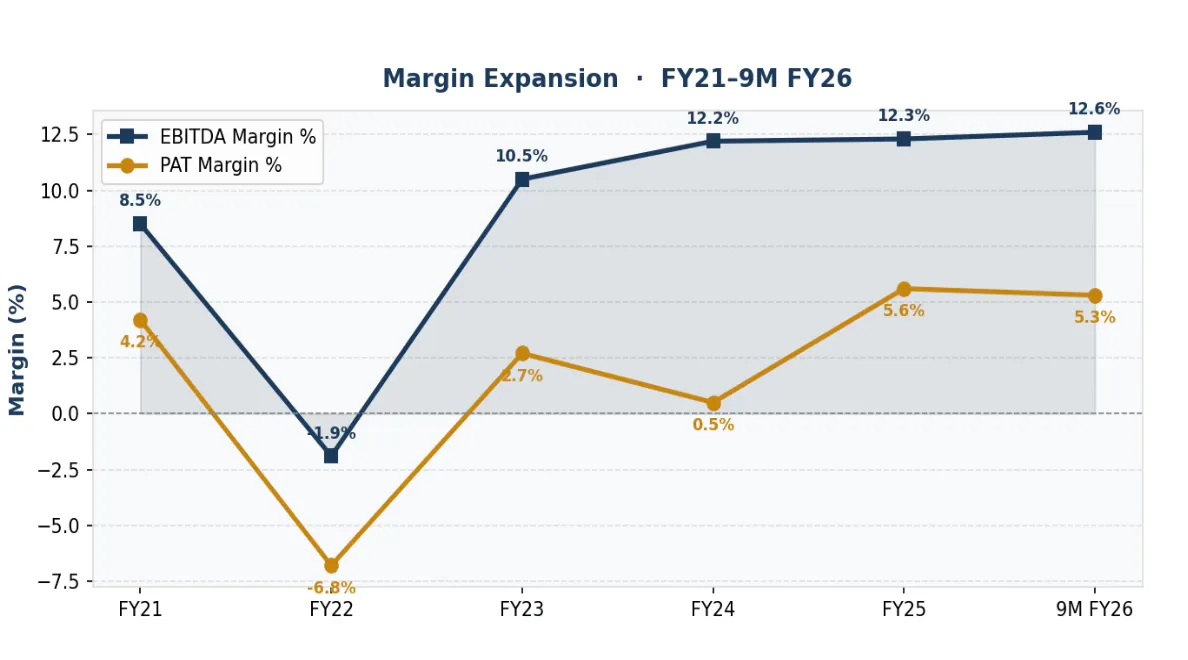
Akums’ financial history is a story of disruption and recovery. The company suffered a significant net loss in FY22 (₹251 Crore) stemming from the acquisition of a loss-making API business and a ₹13,690 Crore non-cash put liability provision related to private equity investor Quadria Capital. Both issues have since been fully resolved. The put liability was eliminated in May 2024 before the IPO. The API business is being restructured. What remains is a CDMO core that has been consistently profitable and cash-generative.
Operating Leverage: The Core Thesis
The most important financial insight about Akums is the relationship between utilisation and margins. The company has 49.6 billion units of annual CDMO capacity running at approximately 40%. The fixed costs depreciation on 14 facilities, regulatory compliance staff, quality control infrastructure are almost entirely committed regardless of utilisation. As volume grows from 40% to 60% utilisation (achievable without major new capex), the incremental revenue flows to EBITDA at a very high conversion rate. If CDMO revenues grow at 15–18% annually over FY26–FY28 (consistent with Q3 FY26’s 16.3% CDMO growth), and if API losses narrow toward breakeven, EBITDA margins should organically expand from 12.3% toward 15–17%. This single variable EBITDA margin expansion through operating leverage drives most of the bull case in this investment.
The Risks: Inversion and Honest Assessment
Munger taught us to invert. Instead of asking “how does this investment succeed?”, ask: “what are the specific mechanisms by which it fails?” This discipline prevents motivated reasoning and forces honest engagement with downside scenarios.
Risk 1: IT Survey Outcome Unknown and Unquantifiable
The Income Tax department conducted a survey of Akums’ premises in February 2026. The details, findings, and potential financial implications have not been publicly disclosed. In the absence of information, investors must assign a probability to outcomes ranging from: no material impact (most common outcome of IT surveys in India) to significant penalties, forced disclosures, or management distraction. This is the highest-priority risk to monitor. It is the one scenario where the investment case could deteriorate rapidly and without much warning. Confirmation signal: any material disclosure in exchange filings related to the IT survey.
Risk 2: API Segment Losses Deepening
The API business acquired in FY22/23 has been a persistent drag. Cephalosporin API prices have been eroding due to Chinese competition and oversupply. Akums is restructuring its API portfolio toward higher-margin complex APIs and is seeking regulatory approvals in the Philippines, South Korea, Vietnam, and Europe. This strategy makes sense but takes time. If API losses deepen beyond ₹150 Crore annually, the drag on consolidated PAT becomes a material story. Confirmation signal: API segment EBITDA losses widening beyond ₹100 Crore in any annual period.
Risk 3: CDMO Client Concentration and Pricing Pressure
Akums’ CDMO business serves 1,400+ clients but the Top 30 Indian pharma companies dominate India’s pharma market (77% by sales). In a market where Akums serves 26 of these 30 companies, the asymmetry of power in negotiations is real. Large clients can negotiate hard on unit pricing, particularly as volumes grow and the client becomes more important to Akums. If pricing compression offsets the volume growth in CDMO, EBITDA margin improvement could stall at 12–13% rather than reaching 15%+. Confirmation signal: CDMO revenue growth outpacing CDMO EBITDA margin improvement for 3+ consecutive quarters.
Risk 4: European Contract Execution and Timeline
The €200 million European contract is a cornerstone of the bull case. However, commercial supplies from Plant 2 (oral liquids) are not expected until FY28, and the annual run rate of EUR 35 million is the steady-state expectation from December 2032. The gap between the announcement (FY25) and material revenue contribution (FY28+) is three years a long wait during which the market must remain patient. Any delay beyond FY29, or reduction in the contracted volume, would materially impair the bull case. Confirmation signal: any formal notice of contract modification or delay from the European counterparty.
Risk 5: FII Exodus as a Signal
FII holdings in Akums have collapsed from 6.36% at IPO to 1.15% as of Q3 FY26. This is a striking and uncomfortable data point. Foreign institutional investors who typically conduct rigorous due diligence are selling. Their reasons could include: valuation concerns at IPO price, the IT survey overhang, weak ROE metrics, or simply profit-booking. The signal should not be ignored. If FII holdings continue declining, it suggests the smart money sees better risk-reward elsewhere.
The Valuation: What Price Makes Sense?
Pharmaceutical CDMO companies, when they are dominant incumbents in a growing outsourcing market, deserve a premium to generic industrial manufacturers. The justification is the same as for any business with high recurring revenue, significant switching costs, and regulatory moats: earnings visibility and compounding power. Indian CDMO peers SAI Life Sciences (55x), Divi’s Laboratories (50x) trade at significant premiums. Akums, at 32x trailing FY25 P/E, appears to be at a discount. But this comparison obscures a critical difference: SAI and Divi’s have EBITDA margins of 22–28% and RONW above WACC. Akums’ 12.3% EBITDA margin and 10.8% RONW do not yet justify the same multiple.
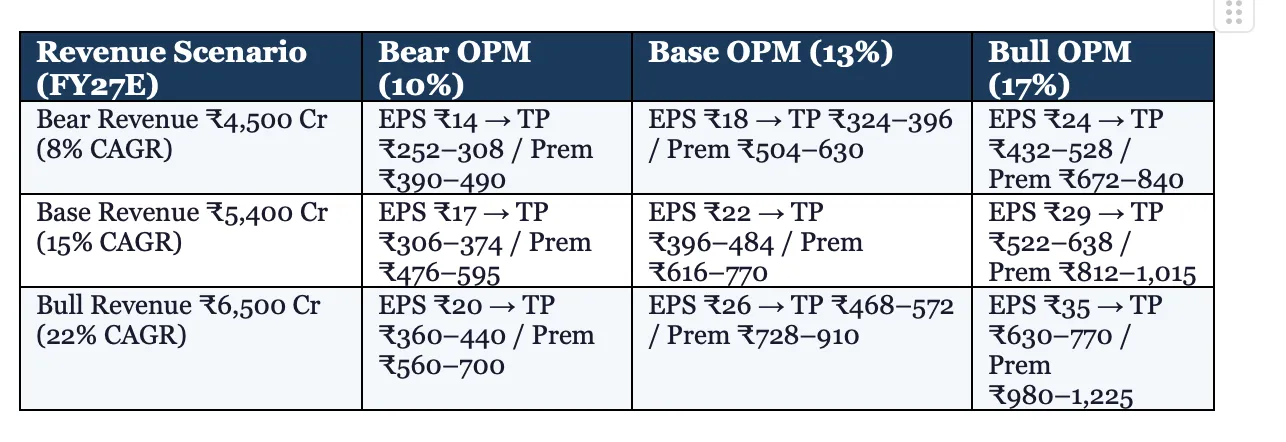
The appropriate framework for Akums is a scenario-based PE matrix, applied to FY27 earnings far enough out to capture the operating leverage story, near enough to not require heroic assumptions. We use a conservative PE range of 18–22x (manufacturing compounder, RONW not yet above WACC) and a premium PE range of 28–35x (if RONW crosses WACC sustainably and European contract ramps as planned).
Reading the Matrix
At CMP ₹480, the stock is priced approximately at the base revenue, base OPM scenario at a premium PE of 22–24x. This is not a bargain. It is a fair price for a business executing in line with expectations. The upside is real but contingent on margin expansion, API breakeven, and European contract ramp. The downside (bear revenue, bear OPM) puts the stock at ₹250–400 a 20–47% correction from current levels.
The ideal entry zone where the base case offers meaningful upside and the bear case is survivable is ₹380–420. At these levels, a base case PE of 18–22x on FY27 EPS implies 5–12% annual returns with asymmetric upside in the bull scenario. At ₹480, the asymmetry is neutral to slightly unfavourable.
A DCF analysis would show that over 65% of Akums’ intrinsic value derives from the terminal value a function of terminal growth rate assumptions and WACC. Given the uncertainty around RONW vs WACC trajectory, a point-estimate DCF is less honest than the scenario matrix above. We prefer the range of outcomes to a false precision single number.
This Report is not prepared by a SEBI-registered Research Analyst. It does not comply with SEBI (Research Analysts) Regulations, 2014 or any other applicable regulatory framework governing investment research in India or any other jurisdiction.
Past performance of any security or financial instrument discussed herein is not indicative of future results. All projections, estimates, target prices, and scenario analyses are forward-looking in nature and involve significant uncertainty. Actual results may differ materially from those projected.
Readers are strongly advised to:
-
Conduct their own independent due diligence before making any investment decision;
-
Consult a SEBI-registered investment advisor or financial professional who is aware of their personal financial circumstances, risk appetite, and investment objectives;
-
Be aware that investing in equities involves substantial risk of loss, including the possible loss of the entire amount invested.
The creators of this Report, and individuals involved in its preparation, hold no positions in the securities mentioned unless explicitly disclosed, and accept no liability whatsoever for any direct, indirect, or consequential loss arising from the use of, or reliance upon, this Report or its contents.
Use of this Report is entirely at the reader’s own risk.
This is a record of the author's thinking in March 2026, kept as written. It is not a recommendation to buy or sell, and the author may hold the securities discussed. See the disclosures.