Latest view on Silver, BTC & GOLD
I invest in BTC & precious metals using a long time frame trend following indicator created and developed by me. The code when plotted on the tradingview shows entry and exit via green and red triangles as you can see below
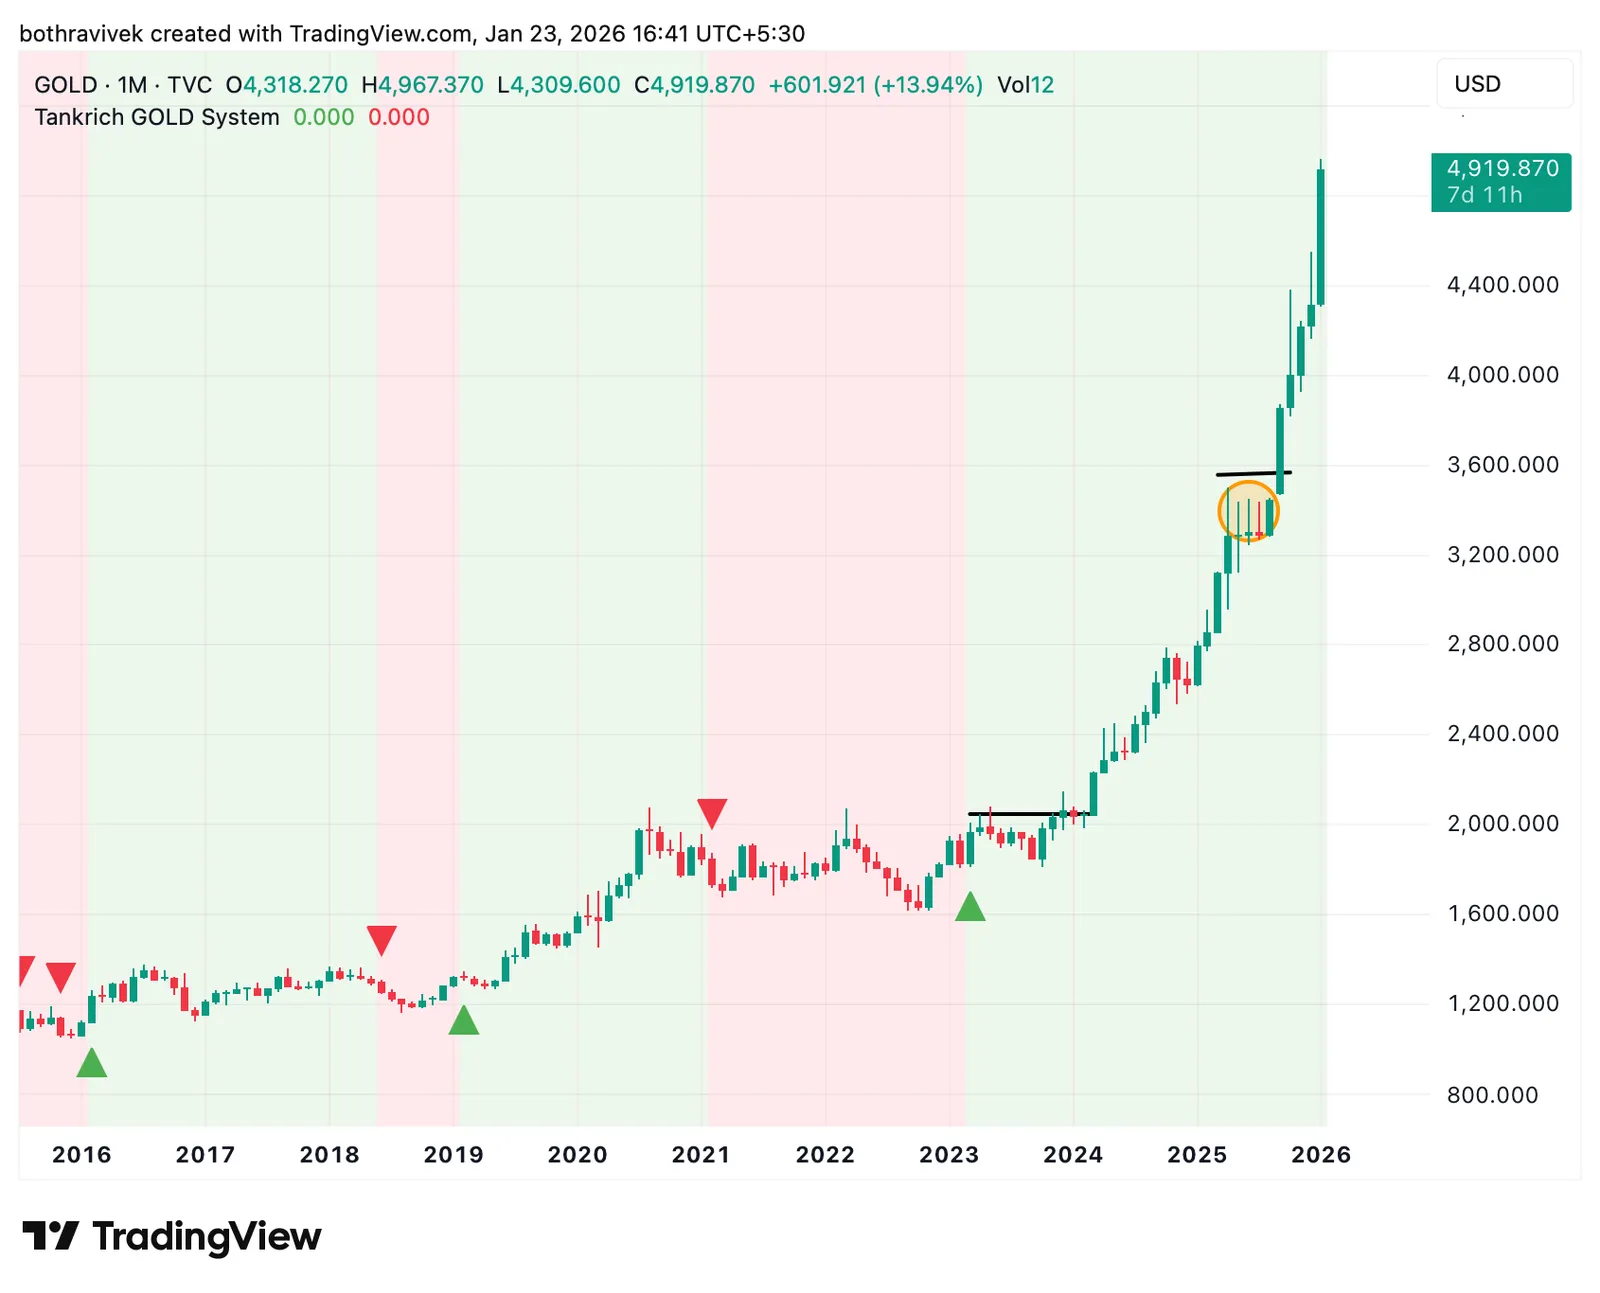
GOLD
Continue to remain invested and increase allocation during consolidating black lines. Time frames used : Monthly
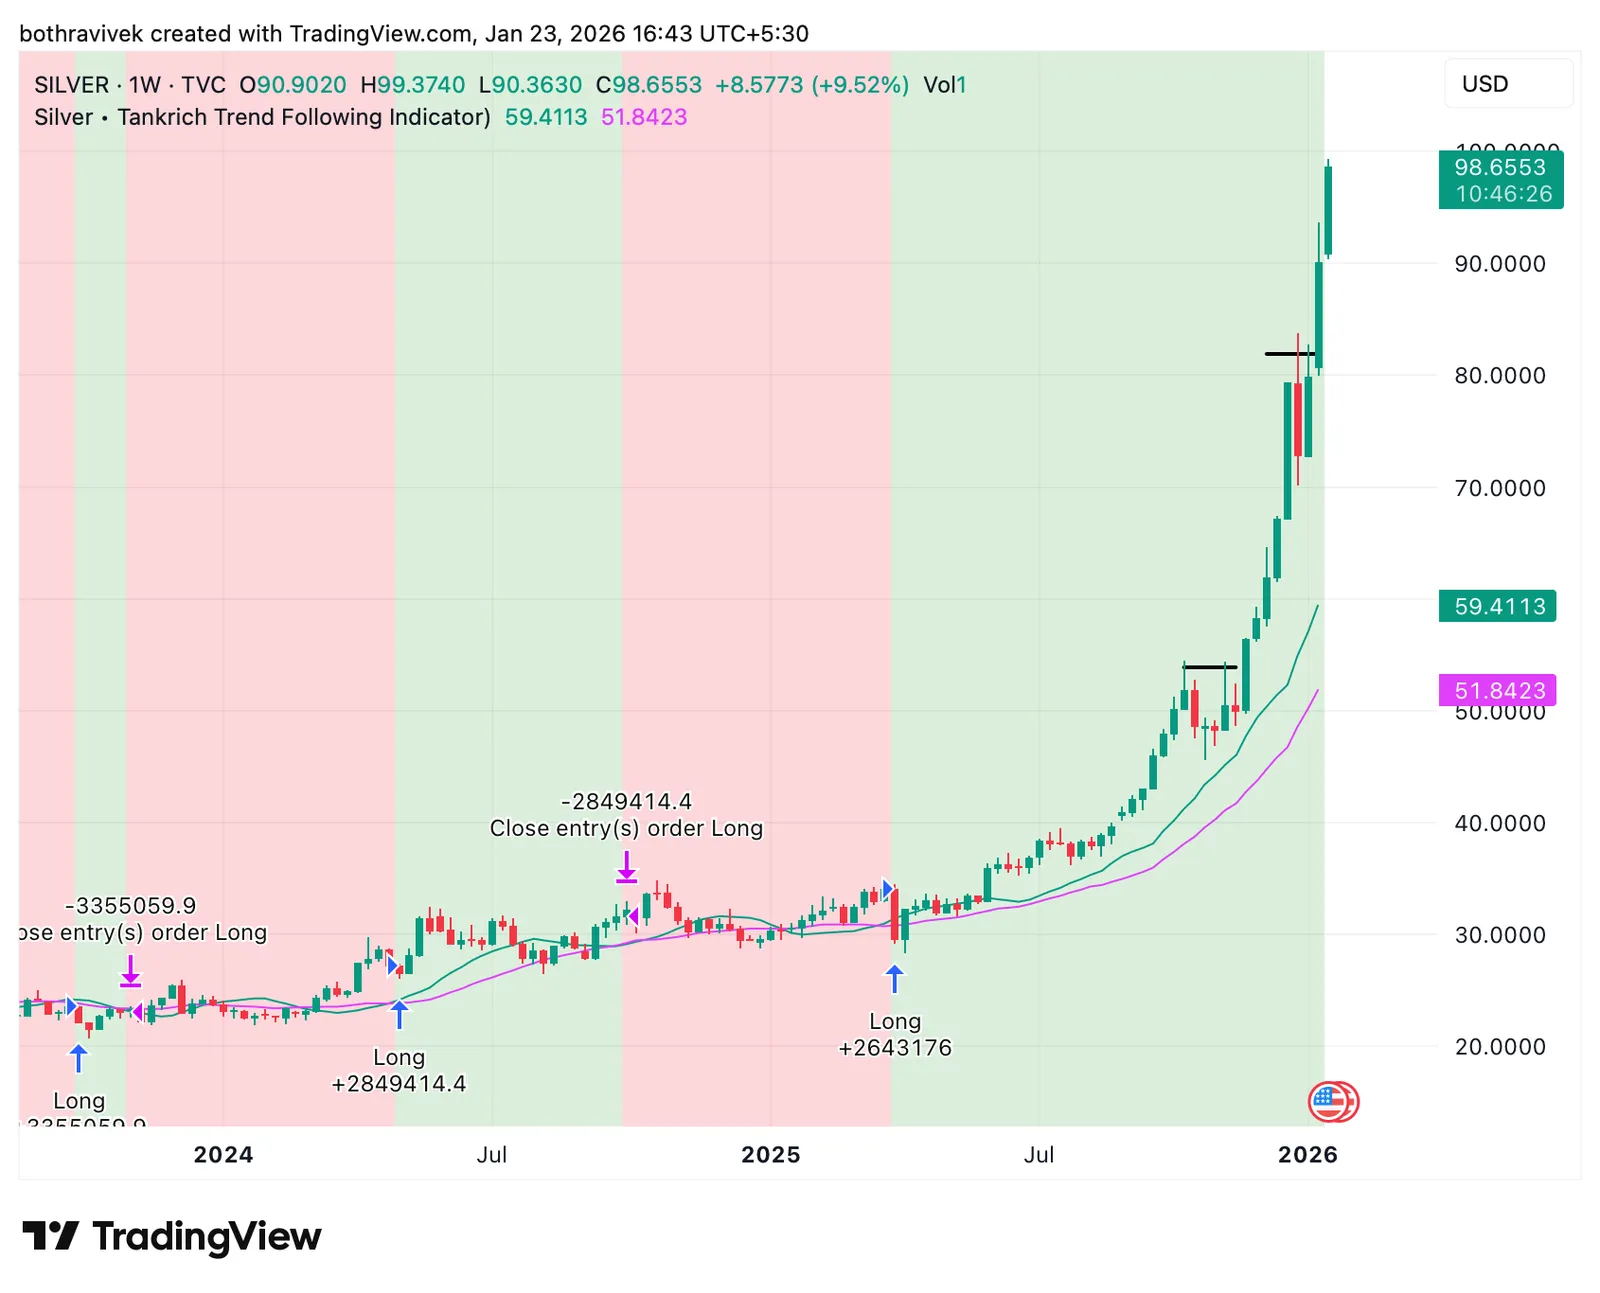
Silver
Continue to remain invested and increase allocation during consolidating black lines. Time frames used : Weekly
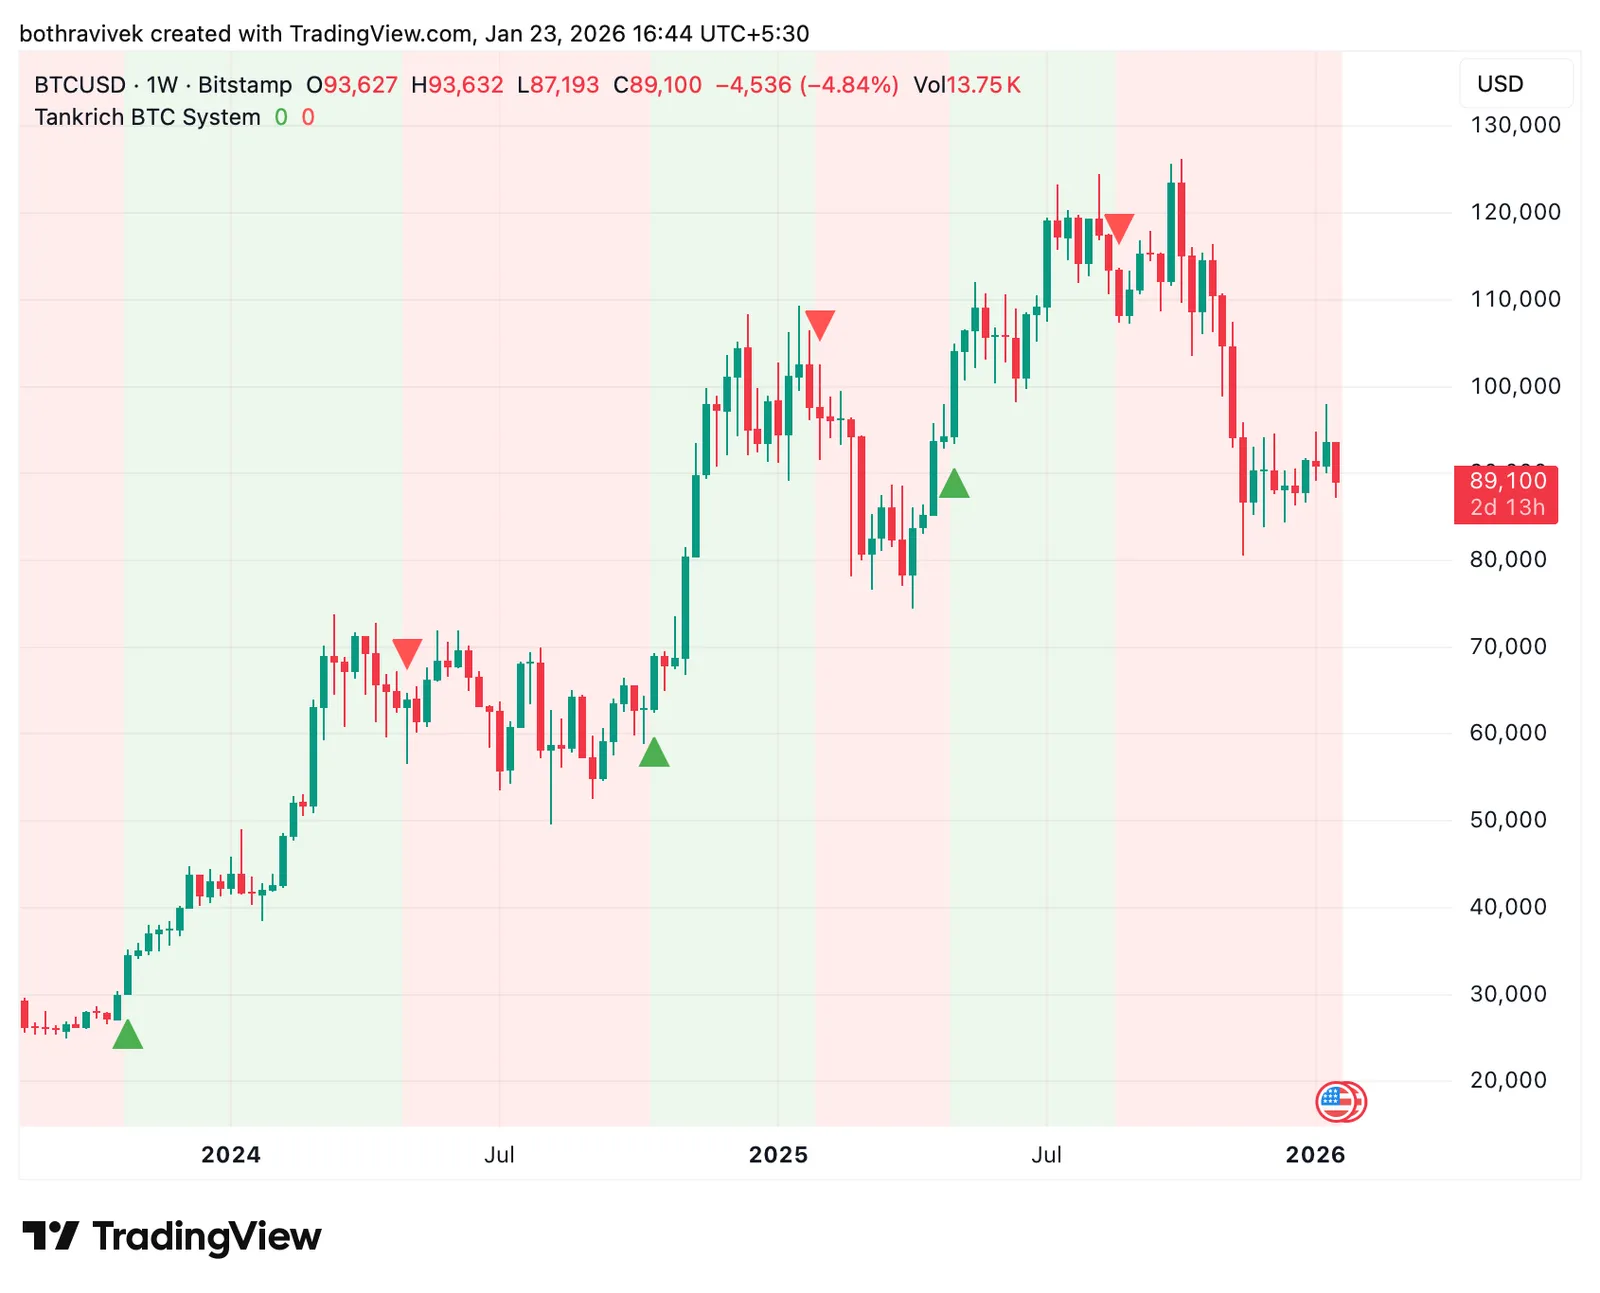
BTC
Well and truly on holidays waiting for signal to turn green
Time frames used : Weekly
To access everything we have built go here