Indian Battery Companies
Porter’s Five Forces is a framework developed by Michael Porter to analyze the competitive environment of an industry. It helps businesses understand the dynamics that can affect their profitability and competitiveness. Doing this for a company or industry sub segment can give an insight into what to track in your invested companies
if you need a qualitative template to analyse you download it from here
However in this post, I want to show how you can use published accounting numbers to approximate in an industry if one company is better placed over others
Lets analyse all factors one by one
#1 Bargaining Power of Suppliers:
This helps in understanding how much power suppliers have in controlling the prices of inputs. If a few suppliers dominate or provide unique products, they have more power, which can affect the cost structure of businesses in the industry, to evaluate this use
Cost of Goods Sold (COGS) by Revenue Ratio
We will be using Indian Battery manufacturer through out this post as an example
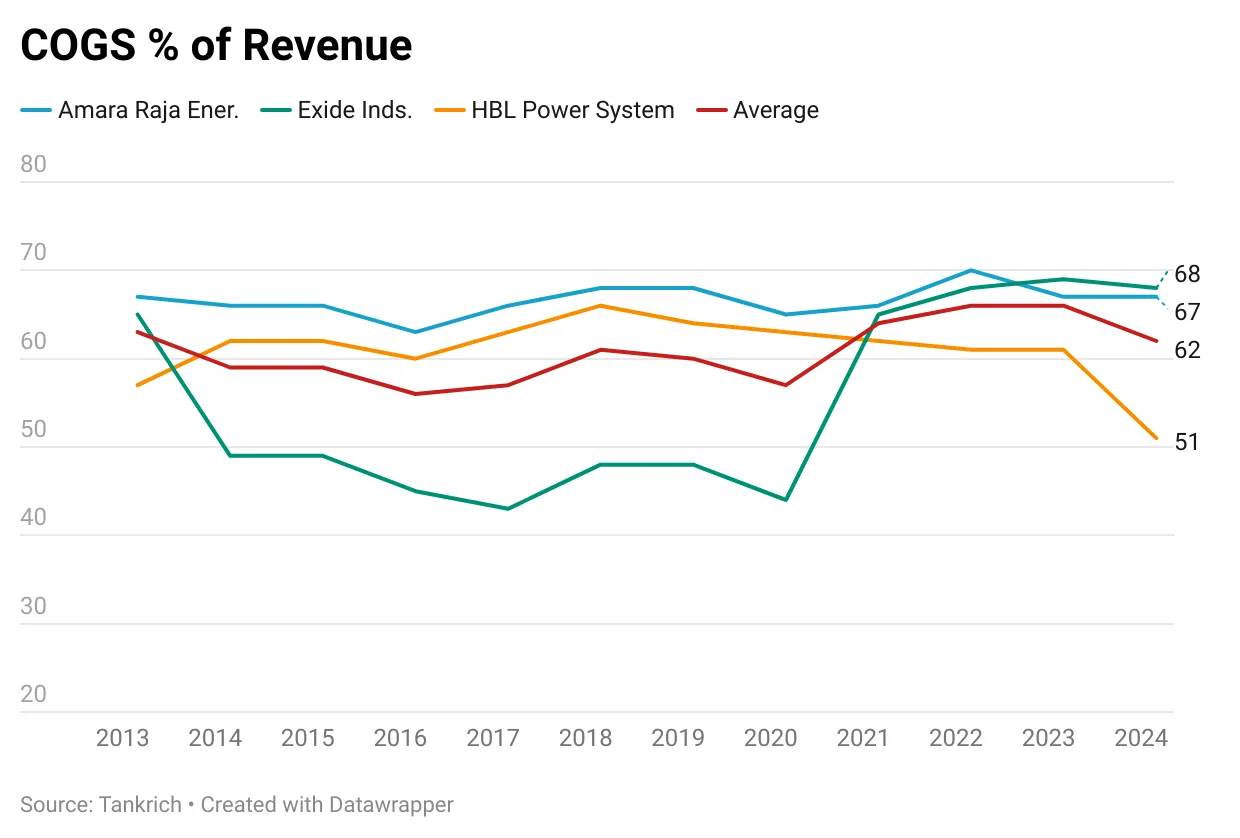
An average of 62% COGS indicates that in this industry suppliers have bargaining power, other things to note
-
HBL is better out of three in this aspect
-
Exide showed significant jump after 2020
#2 Bargaining Power of Buyers:
This force examines the power that customers have to drive prices down or demand higher quality. When buyers have many choices or when products are undifferentiated, their bargaining power increases.
one of best ratios to use here is Debtor Days
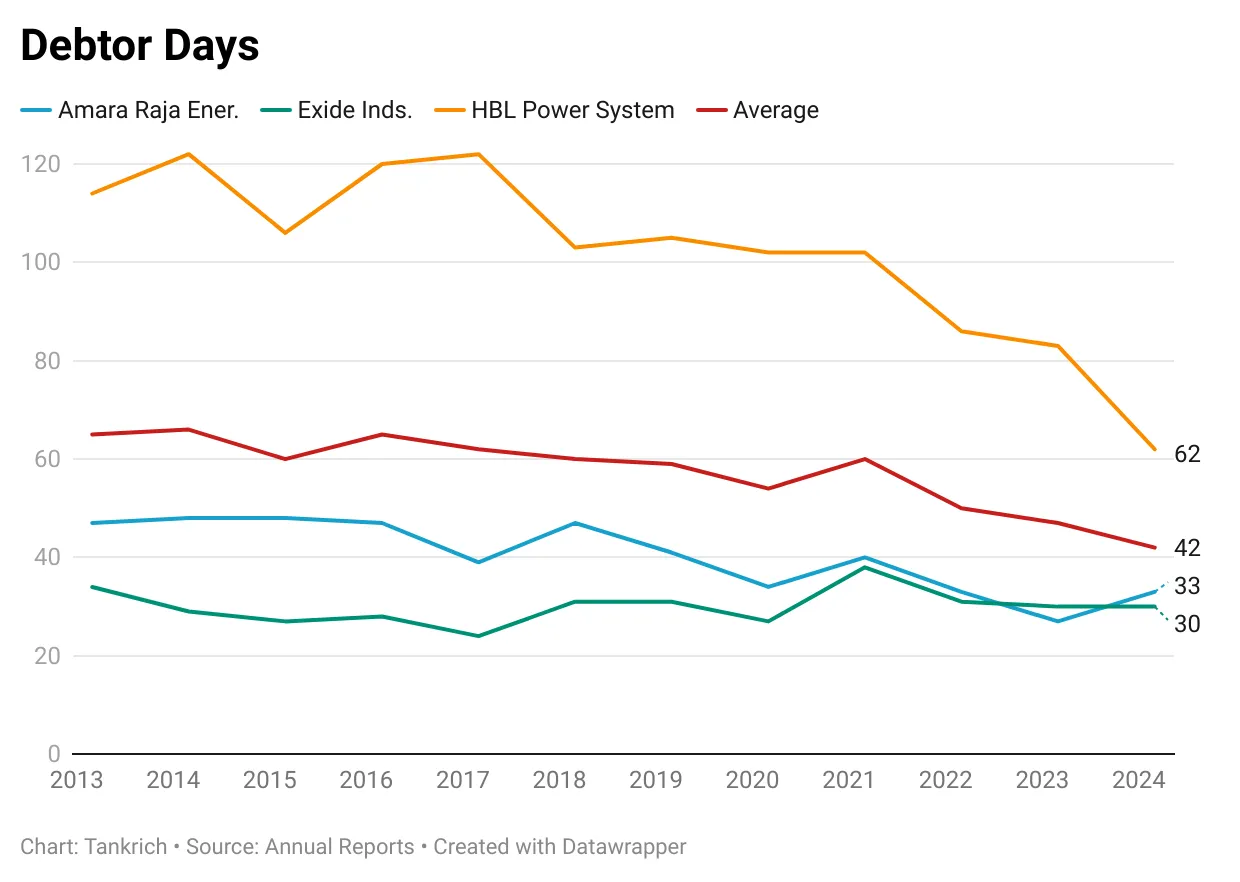
Overall for the companies the number of debtor day are trending down showing lower bargaining power of buyers in the industry again key insight is
- HBL had tremendous improvement in this aspect catching up with peers
#3 Threat of Substitute Products or Services:
This factor refers to the likelihood of customers switching to alternative products or services. If there are many substitutes that fulfill the same need, the threat is higher, limiting the pricing power and profitability of firms in the industry.
We check operating margins to understand this factor
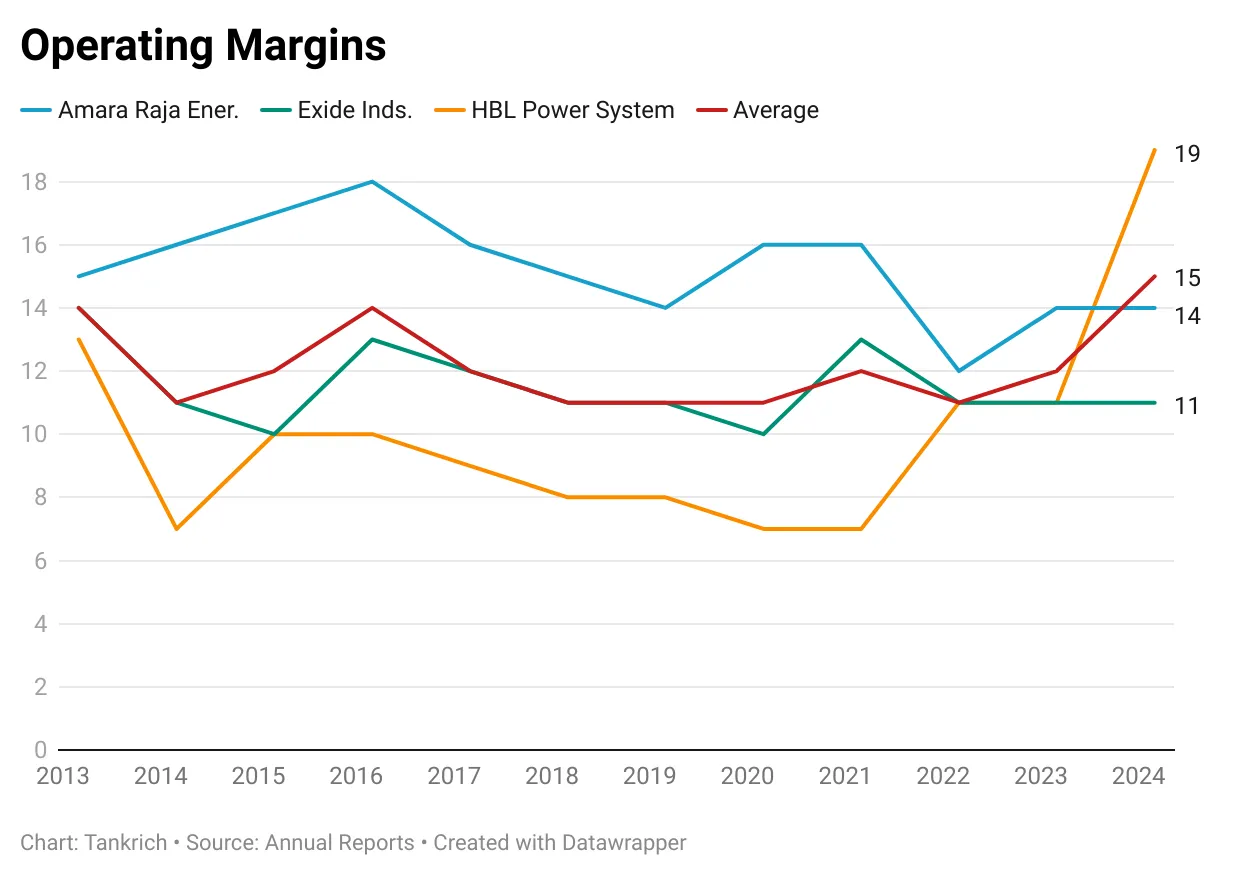
Lower margins below 20% indicate higher threat from substitutes or high competetive rivalry
#4 Threat of New Entrants:
This force examines how easy or difficult it is for new competitors to enter the industry. High barriers to entry (e.g., high capital costs, government regulations) reduce the threat of new entrants.
One way to check for this could be market cap/ fixed assets . if the ratio is high it can attracts players cause by deploying lower fixed cost investments higher market cap (wealth) can be achieved
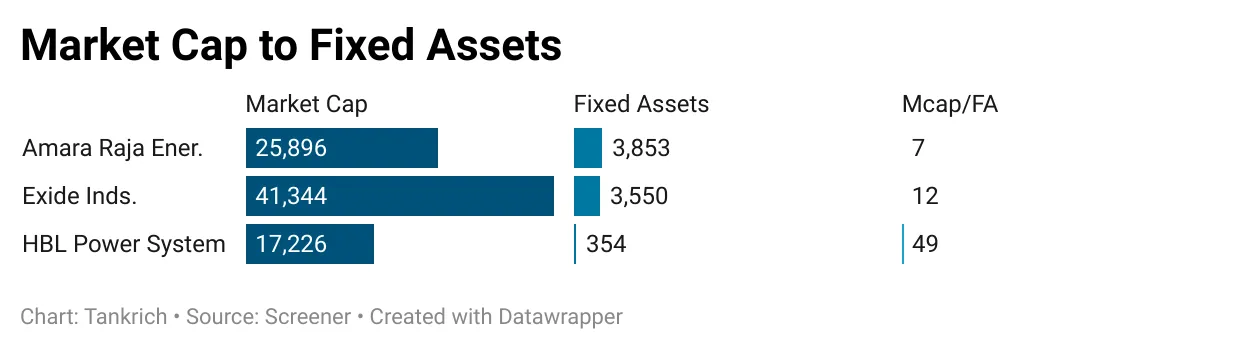
This indicates that industry is likely to attract new competitors as ratio is on higher side.
Based on this HBL Power System is most expensive in this segment.
Any other industry you would like to get analysed leave in comments?
I am going to end every post with something from my photo gallery

Before you go our next free online community event is on ways to tackle cost of living crisis, if you like to attend
This is a record of the author's thinking in October 2024, kept as written. It is not a recommendation to buy or sell, and the author may hold the securities discussed. See the disclosures.