Why stock markets are rising?

Written by 1 min read

It’s 2021, the COVID vaccines are rolling out and the stock markets are making new highs. Here are some charts making sense of this new bull run

India’s overall disposable income has increased 2X in last 8 years
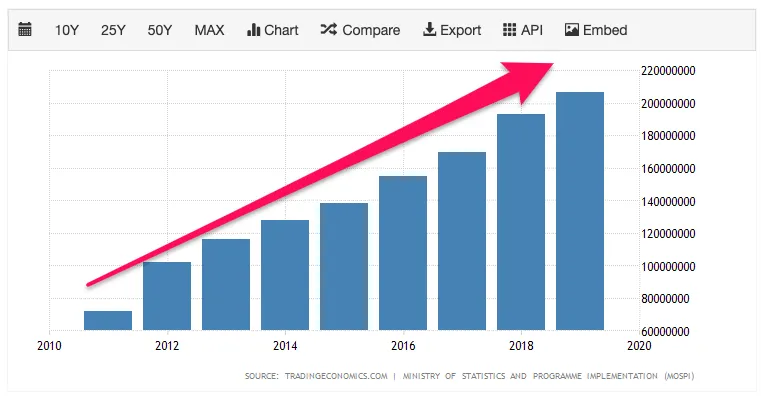
Bar chart of India's disposable income, 2011 to 2019, rising steadily to about 2x over the period

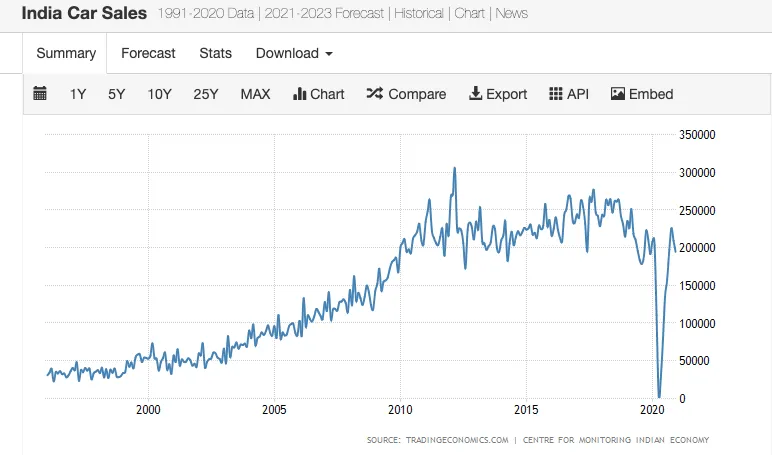
But we are not buying more cars

Line chart of India car sales, 1996 to 2020: growth flattening after 2012 and a collapse to near zero in 2020

In a double whammy covid-19 struck, now we have rising disposable income > lockdown means no spending > leading to huge money left in bank accounts
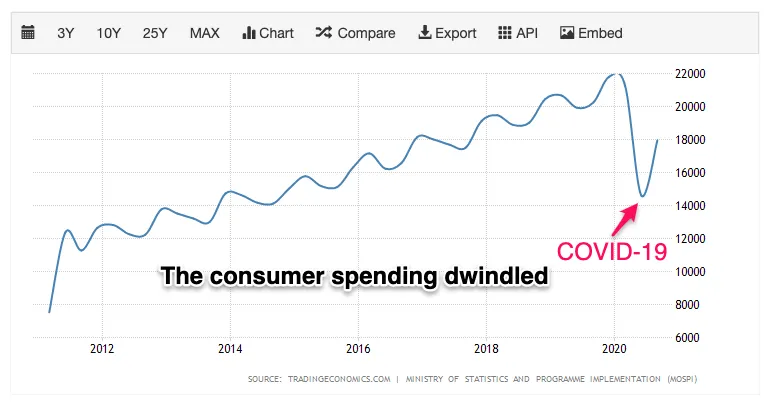
Line chart of India consumer spending, 2011 to 2020, rising steadily until a sharp COVID-19 drop in 2020

This new saved money was searching for returns and the fixed income instruments have become less attractive to savers as interest rates have gone down
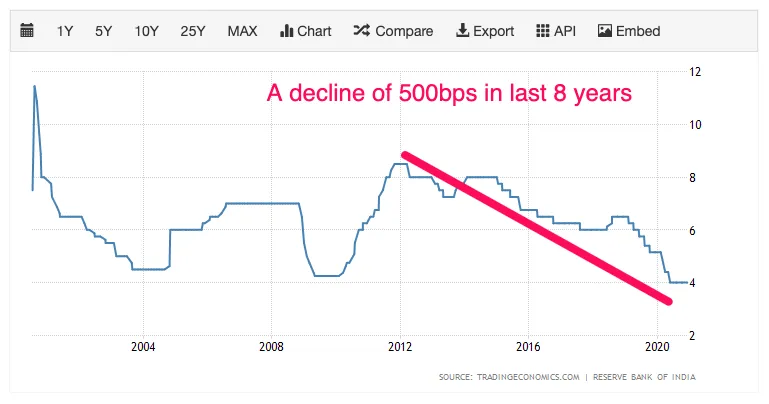
Line chart of RBI interest rate, 2000 to 2020, annotated with a 500bps decline over the last 8 years to about 4%

so these folks opened equity demat accounts in big numbers - CDSL reported their best ever year of account openings
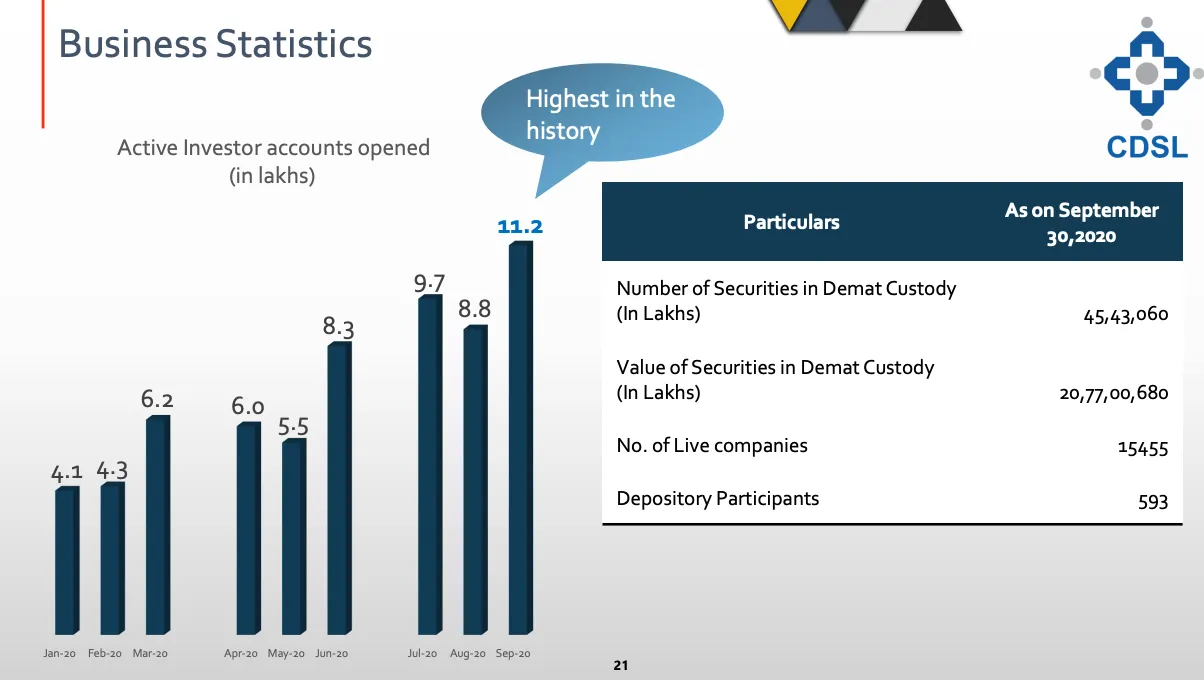
CDSL business statistics: active investor accounts opened per month in 2020, rising from 4.1 lakh in January to a record 11.2 lakh in September

So it is the new money driving markets?

Headline: Retail investors pump in $12 billion as they go direct in stock market

Source

Sure it is but regionally we are much more attractive comparative to other countries for foreign fund flow
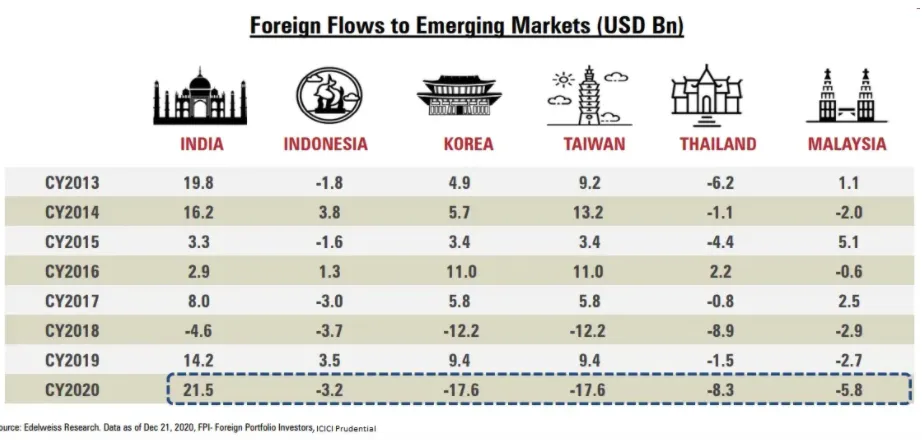
Table of foreign flows to emerging markets, 2013 to 2020: India got $21.5 billion in 2020 while Indonesia, Korea, Taiwan, Thailand and Malaysia saw outflows

with inflows outdoing their previous highs made in 2013

so

  • Low interest rate

  • High retail participation and

  • FII flows

are contributing on liquidity side now lets look at some data on business

Indian business are building assets (investing)

Steel productions is up
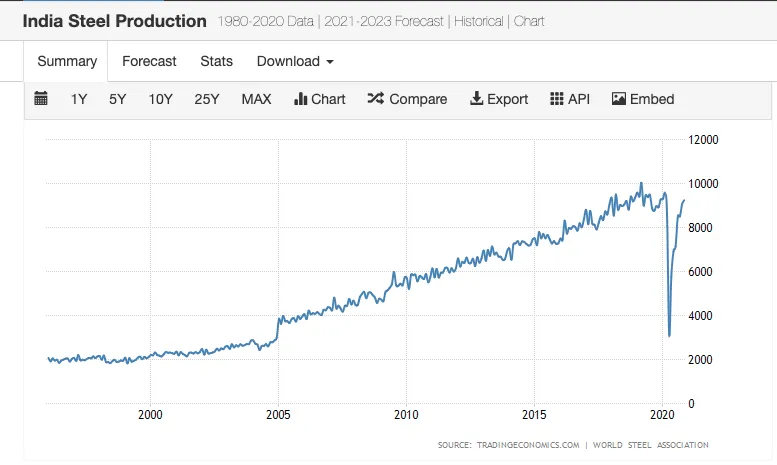
Line chart of India steel production, 1996 to 2020, rising about fivefold with a brief 2020 lockdown plunge and recovery

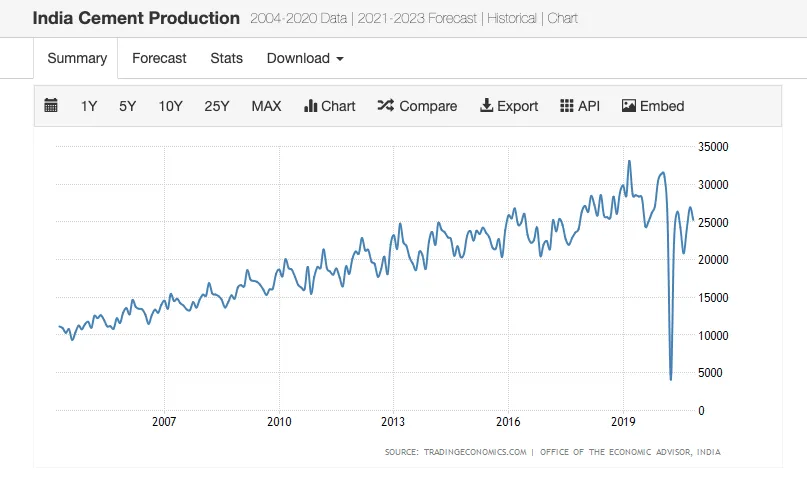
Cement Production is up

Line chart of India cement production, 2004 to 2020, trending up with a sharp 2020 lockdown drop and rebound

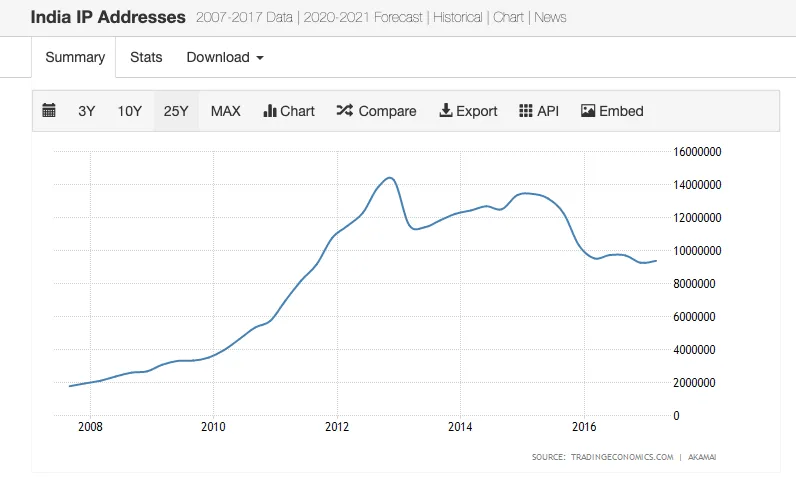
Digitisation is up

Line chart of India IP addresses, 2007 to 2017, rising to about 14 million in 2012 then easing to around 9 million

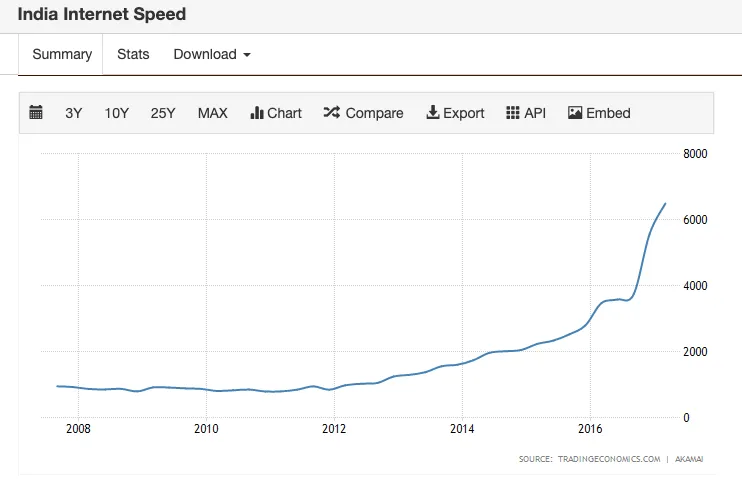
thanks to the JIO revolution

Line chart of India internet speed, 2007 to 2017, flat until 2012 then climbing steeply to over 6,000 by 2017

But capacity utilisation is low - Indicating possible earnings revival
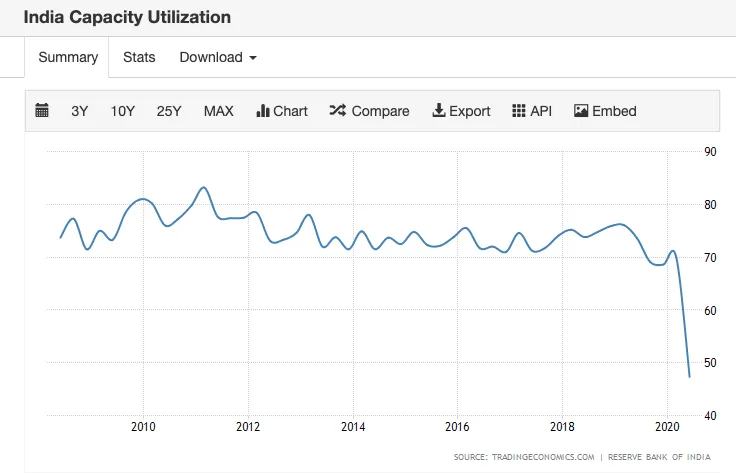
Line chart of India capacity utilisation, 2008 to 2020, hovering around 70% to 80% before falling below 50% in 2020

At least the largest 50 companies are earning well below their median ROE, Source
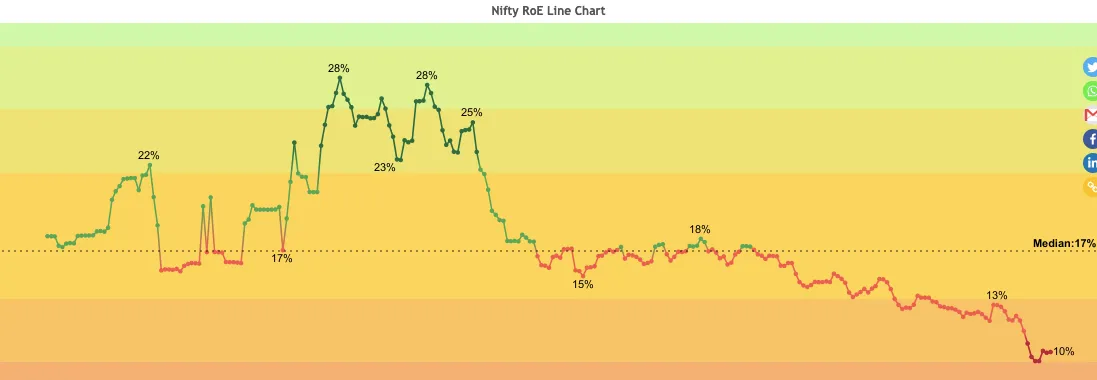
Nifty RoE line chart: peaks of 28% falling over time to 10%, well below the 17% median

So on business side we have huge capex done, lower utilisation and possible earnings revival driving market

***

It was fun exercise delving in Marco rather than Micro. No change in my investment method :) I continue to be company focussed but sometime as they we should step out of our pond and swim in sea

Until next time happy investing

Keep reading

New writing, by email

Free posts arrive in your inbox. Paid subscribers read new research six months before it comes to this site.

Subscribe