Stock picking - Long Consolidation Model
In our previous post we spoke about a stock picking model called as Long Consolidation Model built using Stan Weinstein’s book “Secrets for Profiting in Bull and Bear Markets”
Now there are two ways you can screen for possible stocks
A. Using earnings deceleration followed by breakout
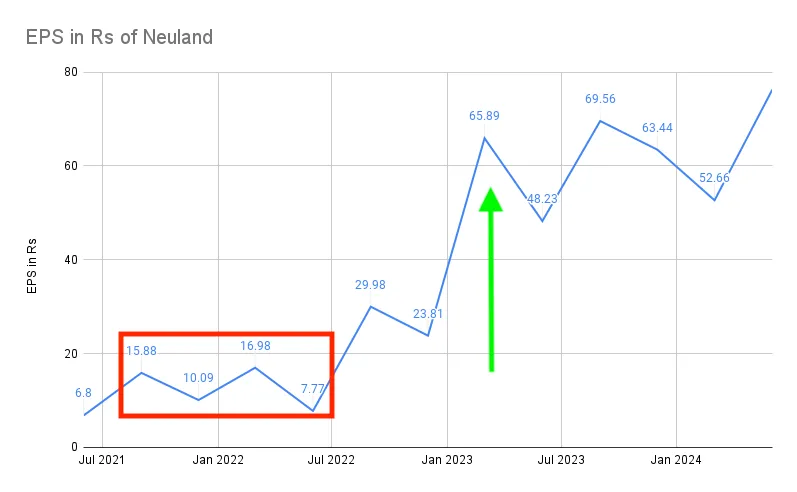
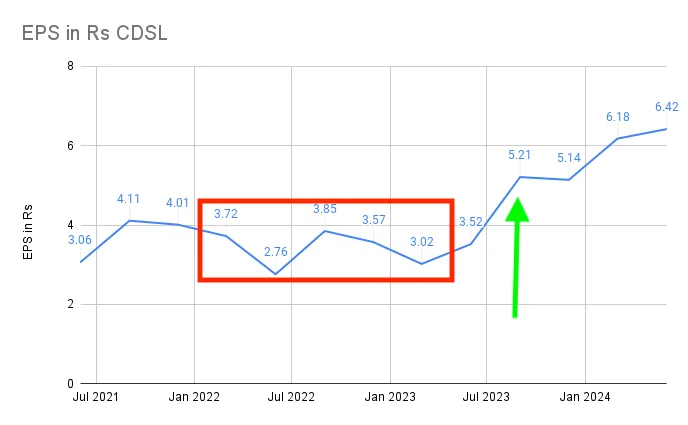
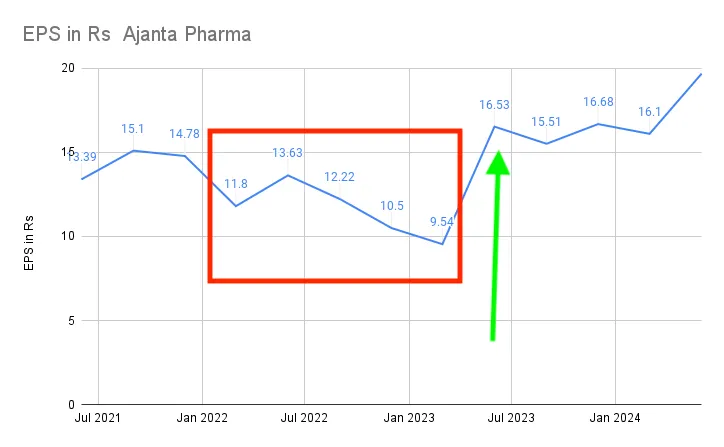
In this phase the company’s EPS goes down or remains flat for several quarters before breaking out with outstanding jump, as a business analyst you can simply track EPS of companies you are interested in and start putting their EPS numbers on simple chart as show below
Lets re-look at examples and see you could have spotted this by tracking EPS
Neulands Labs - Earnings YoYo (Redbox) and the breakout (Green Arrow)
CDSL - Earnings growth stops and remains range bound (Redbox) and then breaks out (Green Arrow)
Ajanta Pharma is similar story - Earnings go down (RedBox) followed by huge breakout in earnings
B. Build a query on Screener / Trading View
-
Create a new Screen with below parameters
-
Return over 3years < 15 AND
Market capitalization > 5000 AND
Volume 1week average > Volume 1year average * 1.3 AND
Profit after tax latest quarter > Profit after tax preceding quarter AND
Return on capital employed > 0
-
This should give you handful of companies which you can start your search
Here is direct link to this query
Happy Investing