Long Consolidation a Model to Pick Stocks
Nothing happens for years and then years happen in few weeks
Good companies often get into temporary set backs
-
Poor one-time capital allocation bad decision
-
Bad supply or demand dynamics
-
Management turnover and change
-
Poor economic environment
or they do well for a period of time and start investing to make their moats more stronger , they go on
-
Acquire skills and technichal knowhow
-
build bigger capacities
-
invest in research and development to develop Intellectual property
-
build sales and organisation to scale to next level
All of above leads to price stagnation and it happens to the best of firms. Therefore one model an astute investor can build is
buying stocks that are beginning to come of out of a 2-3 year price range
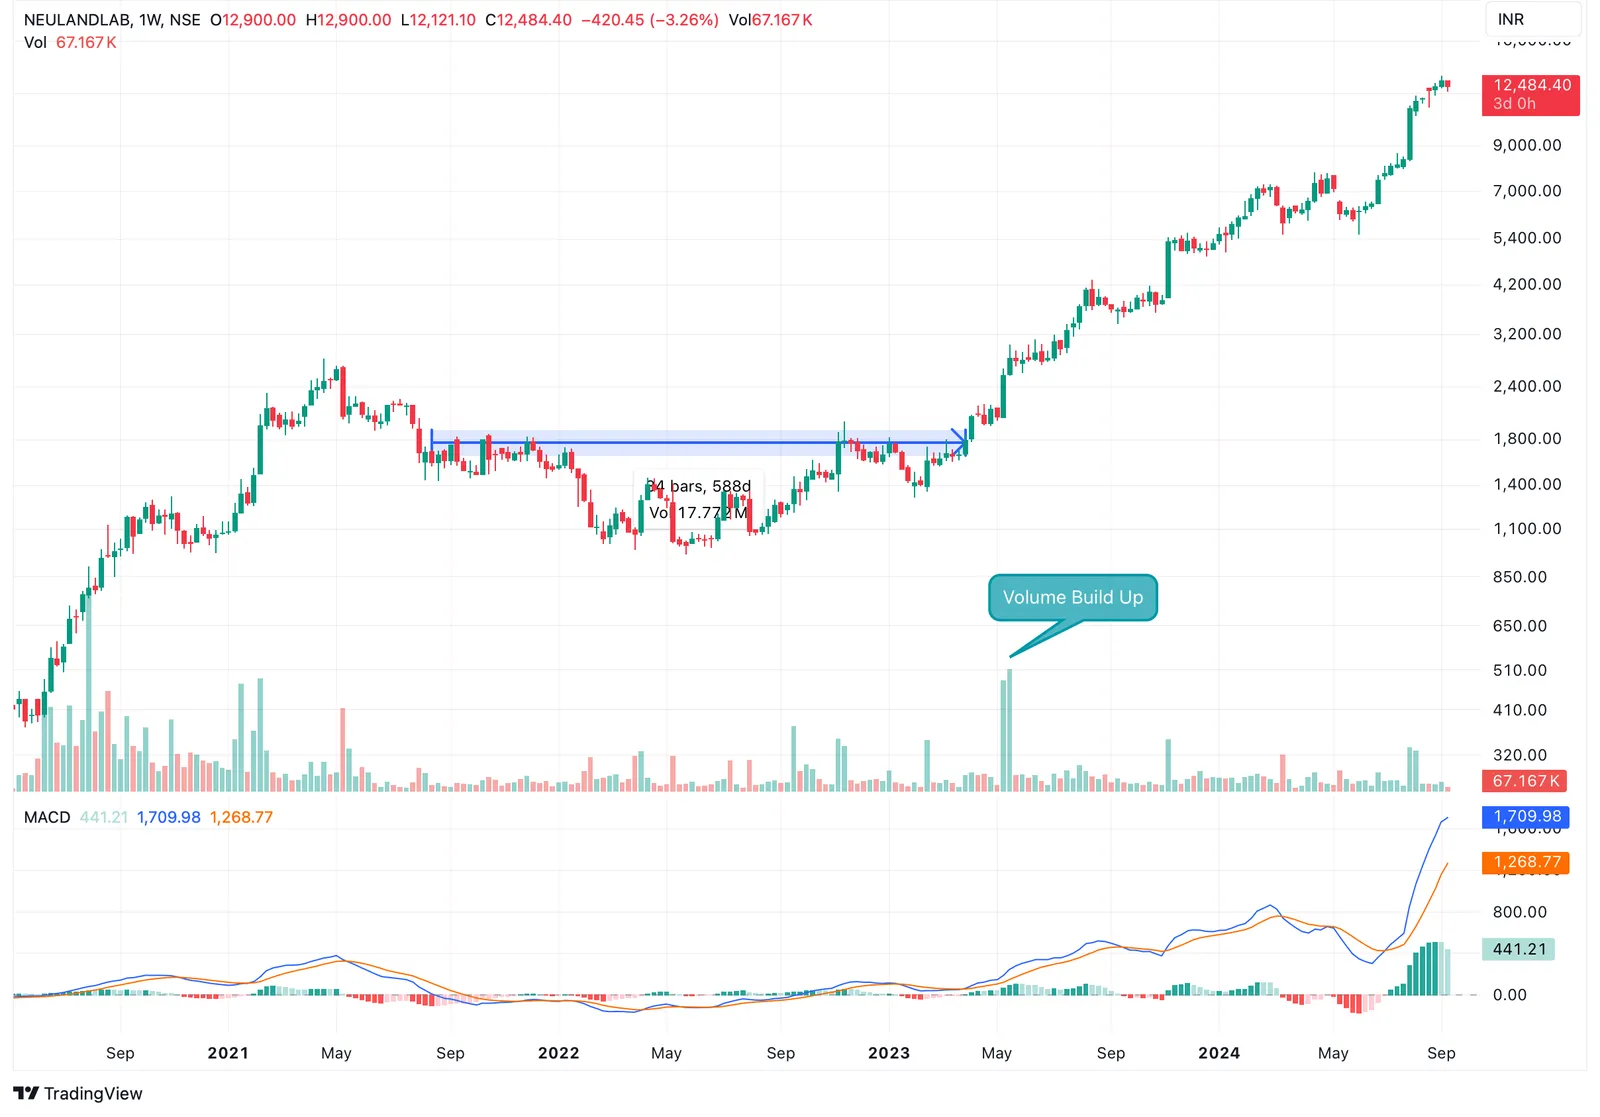
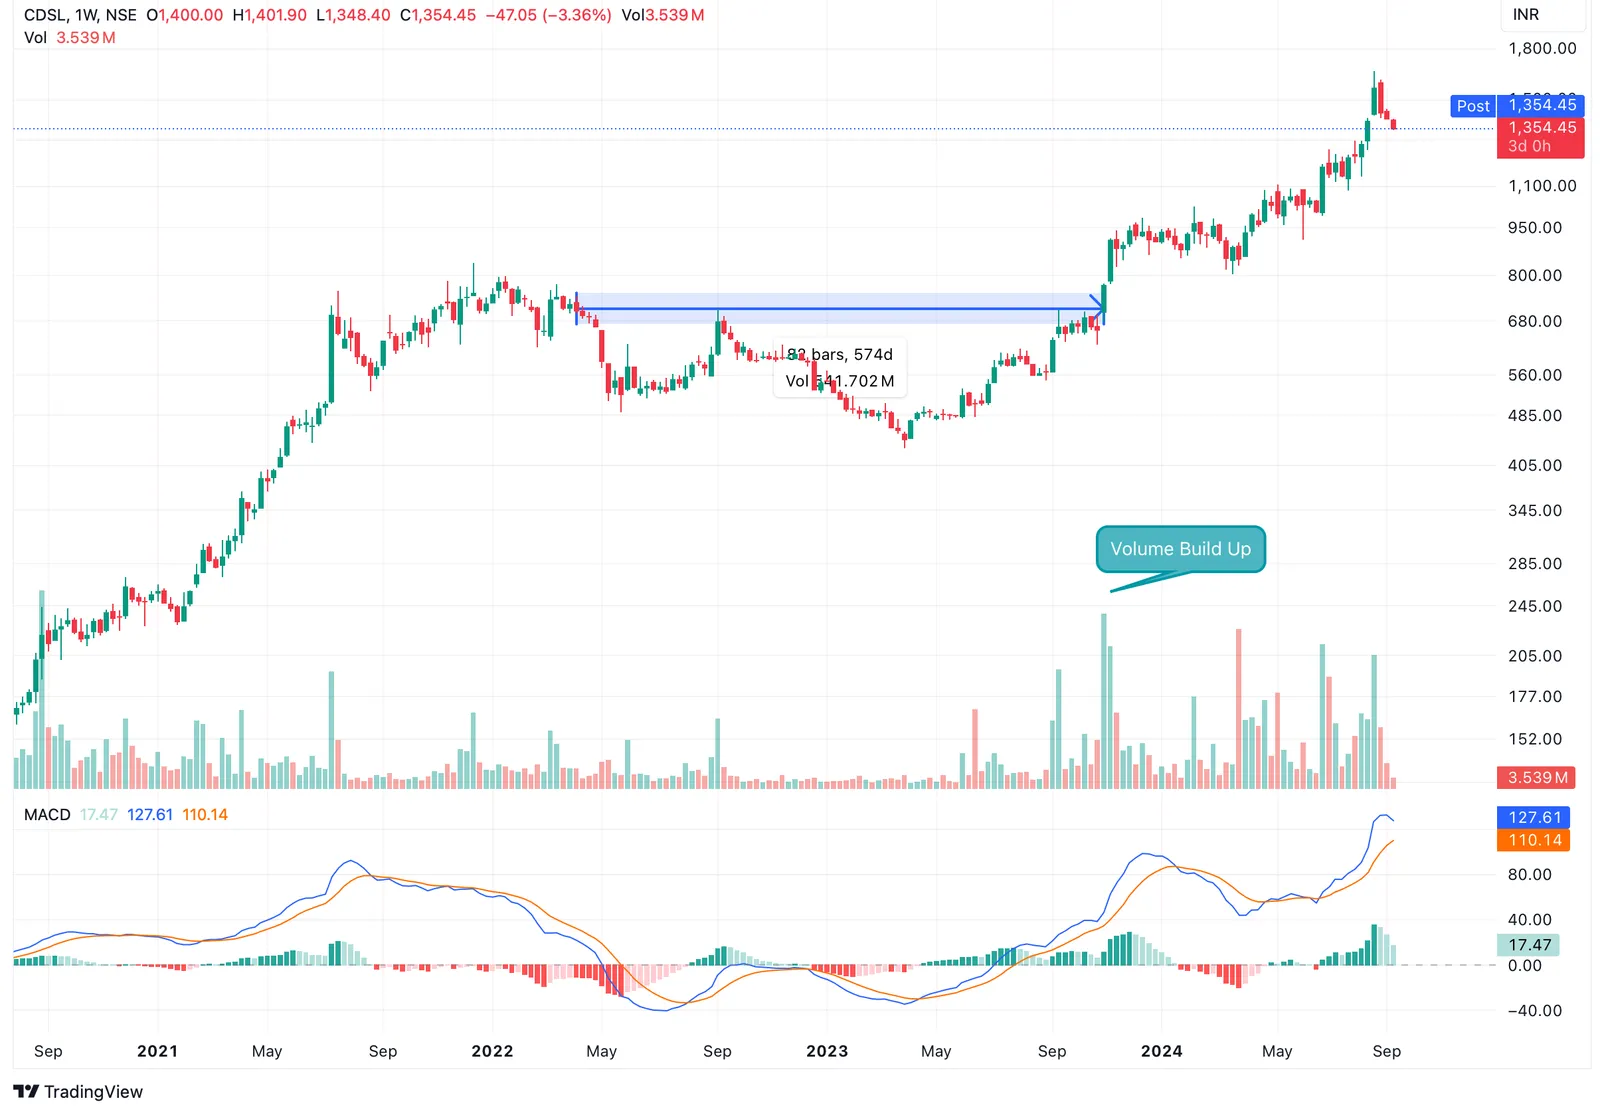
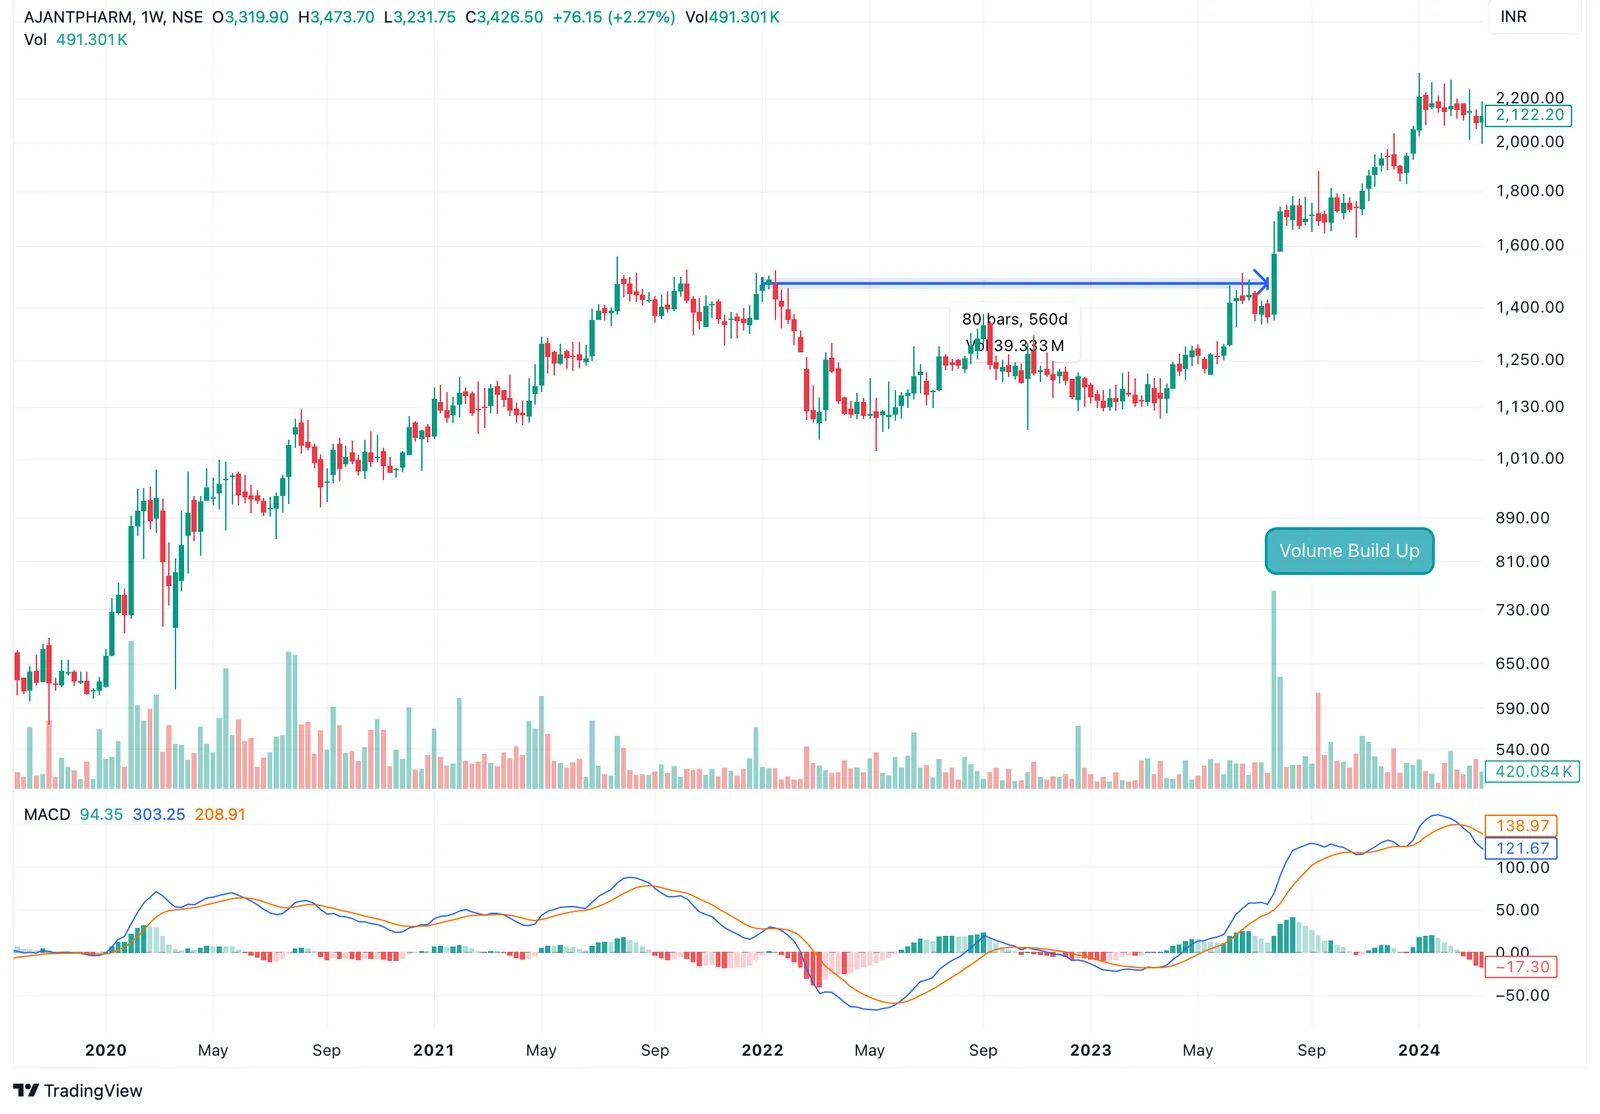
Stan Weinstein’s “Secrets for Profiting in Bull and Bear Markets” talked about buying right when stocks transition from a long period of accumulation into an upward trend. This is the sweet spot for long positions,Volume plays a critical role in Weinstein’s strategy. He emphasises that when a stock breaks out consolidation it must be accompanied by a significant increase in trading volume, confirming that the move is genuine and driven by institutional buying.
First let me share some examples from my portfolio
Neuland Labs - 588 days price consolidation followed by big breakout out of consolidation with volumes
CDSL - 574 days price consolidation followed by big breakout out of consolidation with volumes
Ajanta Pharma - 560 days price consolidation followed by big breakout out of consolidation with volumes
You don’t have to be chartist to be find these, although I should say modern charting and screening software makes it incredibly easy.
In next post we will discuss how you can spot them using two methods
Happy Investing