Momentum Investing: Winners Keep Winning
If you’ve ever wondered why some stocks keep climbing while others just fade away, this note is for you. A new October 2025 paper by Guido Baltussen and his team takes a hard look at “momentum investing” – the idea that recent winners tend to keep winning and laggards often stay weak. They run the numbers on 150 years of data and show it’s not a fluke, but a durable return driver that has evolved over time. I’ve boiled their work down into simple, practical language. Let’s walk through it step by step.
Think of physics: a moving object keeps moving until an opposing force stops it. Markets show a parallel assets that have been rising (or sliding) often continue in the same direction for a while. That core philosophy stayed simple: recent winners tend to keep working, and recent laggards often stay under pressure.
Connect with me
Courses
Trading View Indicators
Data Driven Mutual Funds
back to article,
This wasn’t a fad idea. Academic work in the 1960s first pushed back on the clean-sheet “efficient market” view that said price history carries no predictive signal. One of the earliest 1967 studies documented that stocks already beating the market average often continued to outperform. By 1985, research showed that 1-year winners delivered a meaningful edge, close to 7–8% annualized above the broader market. In 1993, a landmark U.S. study cemented the evidence that momentum persisted as a systematic, repeatable return driver rather than random noise.
Momentum eventually expanded far beyond equities — showing up across bonds, FX, and commodities as well. Today it’s not niche theory; it’s scaled into mainstream portfolios, with institutional and retail products collectively allocating billions into momentum-based strategies.
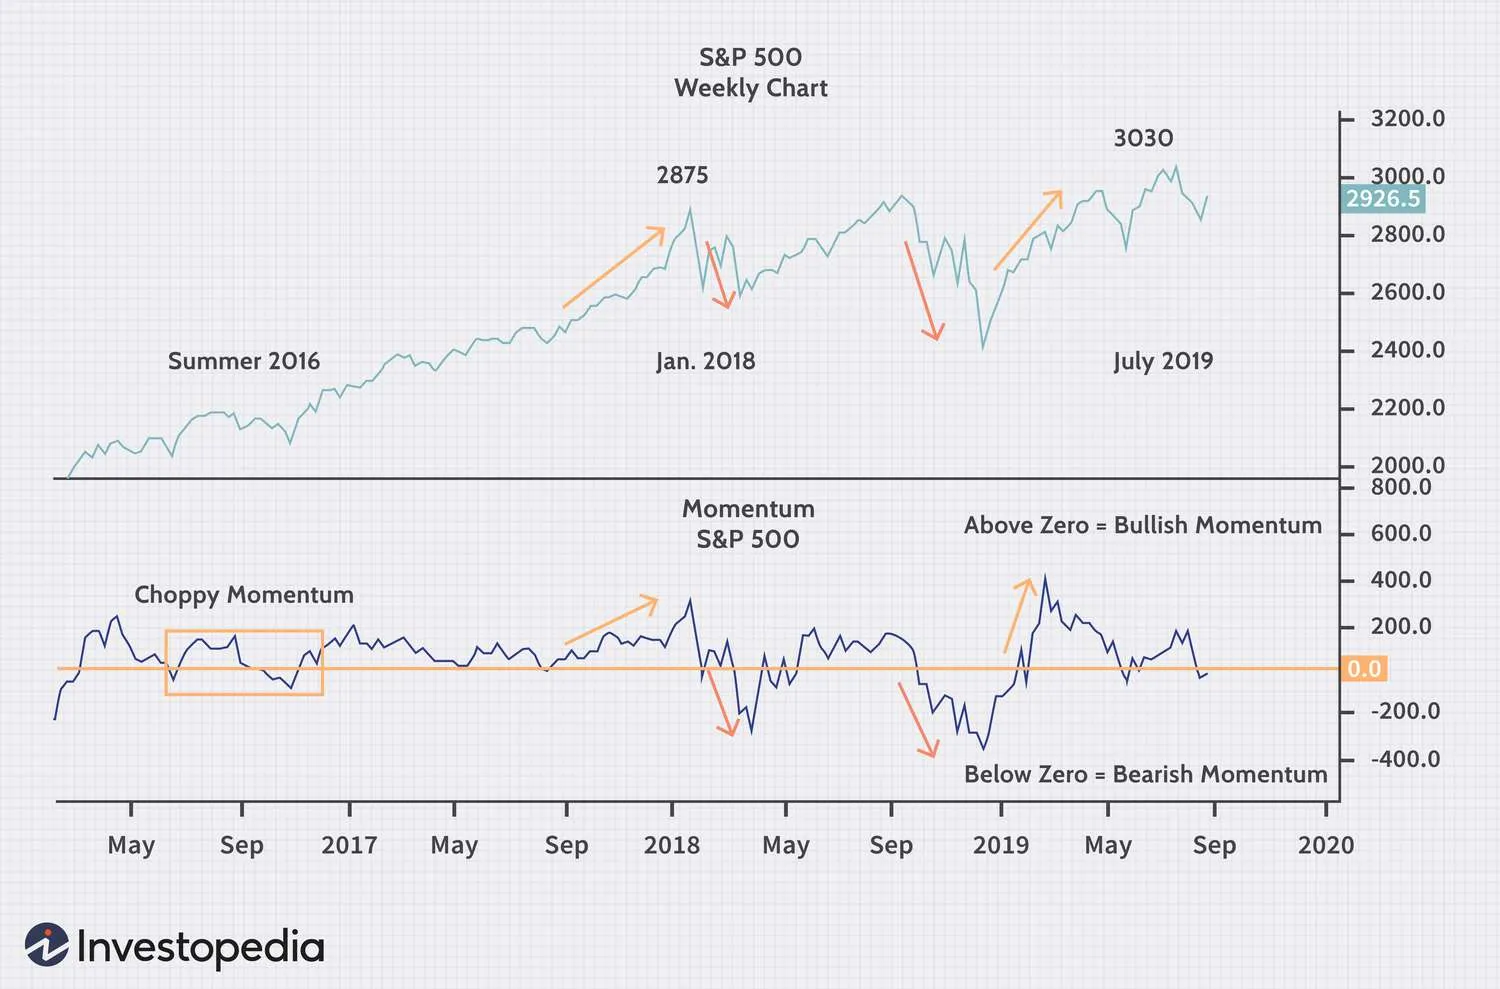
They rebuilt the original 1993 momentum test on U.S. equities (1965–1989). Stocks were ranked on the prior 11 months of returns, ignoring the most recent month to reduce reversal-driven noise. The strategy was simple: go long the top-ranked (winners), short the bottom-ranked (laggards), and hold the spread for one month before rebalancing.
The gap was material roughly 11.3% per year when measured within large, liquid names, and closer to 13.4% on an equal-weighted basis where smaller caps amplified the effect. The study confirmed the payoff was statistically meaningful, making a strong case that momentum carried a reliable signal, not randomness.
They even tested other eras for sanity. Between 1927–1964 (before the original test window), the edge hovered around ~9% annually. From 1990 through 2024, the premium didn’t vanish sustaining in the 8–10% zone depending on weighting and universe design. When stitched end-to-end from 1927 onward, momentum delivered an estimated 9–10% per year performance advantage versus its corresponding short-leg portfolio.
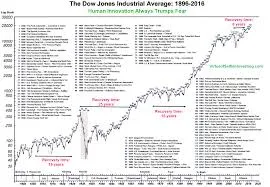
Still doubtful? They broke the strategy across the globe. Using data from 46 countries (1990–2024), momentum returns stayed positive in every major region. Outside the U.S., it delivered about 7.6% annually in developed international markets and roughly 6.2% in emerging economies. Within Europe, results differed by country but never flipped negative Portugal topped the list Japan and Japan and parts of Asia showed the softer side Japan being one of the lighter contributors.
They rewound even further. U.S. equities from 1866 to 1926 maintained an ~8% yearly momentum advantage. Stretch the full window 1866 through 2024 the average edge lands close to 9% per year. The compounding is wild a dollar invested at the start grows past ten thousand dollars by the end. That isn’t a typing mistake that’s the math working without interruption.
And the market didn’t arbitrage it away after it became popular. Over 159 years, there was no regime where momentum premiums structurally collapsed. When they brute forced over 4,096 different construction variations ranking periods, weighting schemes, filtering rules every single version produced positive momentum spread returns. The takeaway is uncomfortably simple momentum has survived data, discovery, geography, and endless stress testing.
Momentum used to be just about price trends, but the field matured. Researchers have shown that adding non-price signals improves the odds:
Fundamentals carry their own momentum effects. Earnings surprises historically added a 2 to 9% premium, analyst upgrades contributed roughly 5 to 8%, and structured sentiment from news delivered a smaller 1 to 4% lift. When blended together, these signals strengthened the opportunity set, particularly among smaller, less efficiently priced stocks, where the combined edge leaned toward the higher end of return ranges.
Another improvement was filtering out broad market movements to isolate “residual” momentum at the stock level. By removing systematic market forces, the factor exhibited lower volatility while still delivering spread returns in the ballpark of 7 to 13% annually.
Certain price anchors stayed predictive too. Stocks trading close to their 52-week highs continued to show a consistent 9 to 10% forward premium, reinforcing that behavioral reference points persisted as valuable trend markers.
Momentum also showed up in networks. Industry peer baskets produced spread differentials between 5 and 14%, text-derived corporate relationship graphs captured roughly 10 to 14%, and clusters of connected analysts delivered some of the highest network premiums, spanning 7 to 18%, depending on linkage density and weighting design.
Even investment styles exhibited trends. “Factor momentum” across strategies historically delivered a 6 to 12% premium, showing that investment approaches themselves moved in phases rather than completely mean reverting each cycle.
The ultimate experiment was stacking price, fundamentals, anchors, networks, and factors into combined momentum. The result was a 6 to 10% spread payoff, but with diluted volatility, improving the ride quality versus pure price-based momentum. The conclusion was simple: momentum evolved into a multi-signal, cross-asset, and cross-market factor that prioritized smoother compounding without sacrificing a meaningful performance gap.
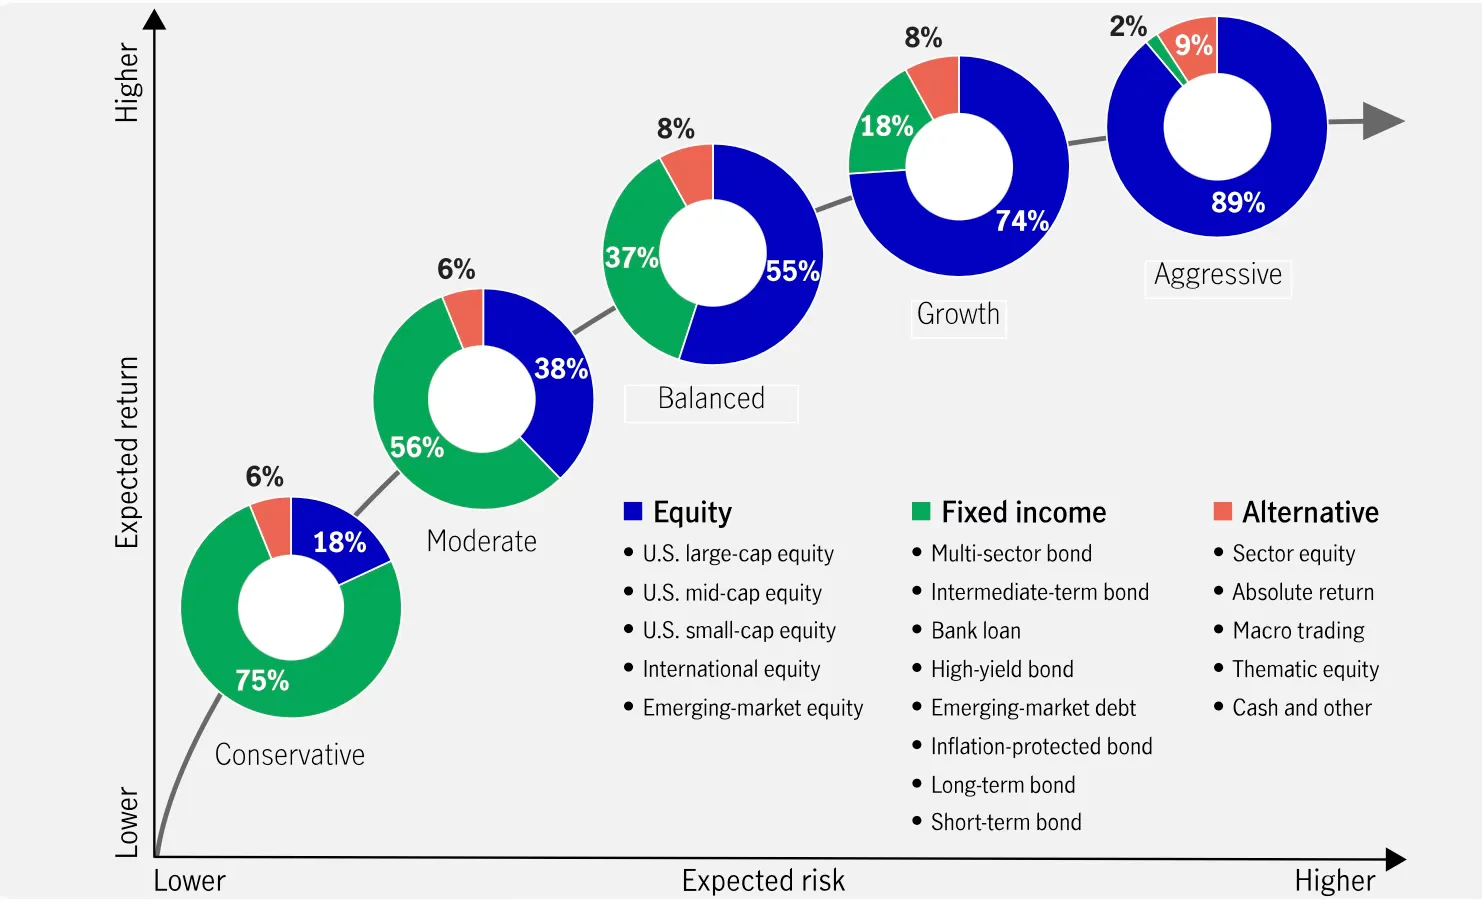
Momentum has its dark chapters. It saw devastating crashes in periods like 1929 and 2009, where momentum spreads were hit extremely hard, close to 88% drawdowns in the worst stress windows. The driver was almost always the same violent market reversals after extreme directional runs.
But smarter risk management changes the math. When momentum positions were sized using recent realized volatility, the long-short momentum spread delivered performance close to 18% per year, while cutting historical crash severity risk by almost half. Combined multi-signal momentum versions, by design, were already less fragile they still corrected sharply but the worst historical stress case sat closer to 57% drawdowns, less crash intensity than pure price momentum.
Why does momentum persist at all? Its payoff structure is far too consistent, across countries and centuries, to be dismissed as randomness. Macro risk channels like economic cycles, liquidity conditions, and funding shocks explained part of the premiums. But the most enduring explanations came from human behavior the market doesn’t move purely on data, it moves on how humans delay reacting to it. News underreaction, overconfidence after winning streaks, group herding around trends, and a deep reluctance to cut losers early or even sell them at all collectively created the sustained drift that momentum systematically harvested. Models built between the 1990s and 2000s captured this best by combining investor psychology with trading constraints and boundary conditions like short sale limits, capital frictions, and execution bottlenecks.
Should an investor adopt momentum today? The evidence says it is a long-lived, adaptive, and improvable return factor, with clear risk-aware upgrades that improve long-run compounding quality. It’s no longer just a price trend game, it’s a layered factor pulling from fundamentals, reference anchors, global dispersion, and structural risk scaling. For long-term allocators, it has behaved more like a persistent tool than a passing anomaly, and for quantitative builders, it remains one of the richest areas for testing edges, risk overlay design, and factor interaction logic.
One principle matters most the numbers shown above are based on summarized academic findings, not personalized portfolio advice. Stress test, look at leverage, understand sequencing, and build with risk limits that survive both trend and reversal regimes. Momentum rewards structure, not bravado. read the full paper