How I missed Canfin Homes
Written in April 2017. There is newer research on Can Fin Homes: Canfin homes - The out performance continues (August 2017).
There is a beautiful passage in Steven Johnson’s Where Good Ideas come from
“Good ideas are like the neo nurture device. They are, inevitably constrained by the parts and skills that surround them. We have a natural tendency to romanticize breakthrough innovations, imagining momentous ideas transcending their surroundings…… We like to think of our ideas as $40,000 incubators direct from factory, but in reality they have been cobbled together with spare parts that happened to be sitting in the garage.”
This passage has a striking resemblance to how I look for new companies to invest, trying hard to find a hidden jewel in an obscure corner outside BSE 500 without realizing that many of them are tangled in many spreadsheets stored on my PC
Let me run you past one such case last year I was reviewing one of my existing positions GRUH Finance and unlike previous years I wanted to review GRUH not only in comparison to itself but to its peers – REPCO and Canfin homes. The reason for picking these two Housing Finance Companies was
-
I also had REPCO in my portfolio so I will kill two reviews in a single seating :)
-
Loan book size was roughly same and they lent to similar customer profile
I began my doing size comparison and comparative performance

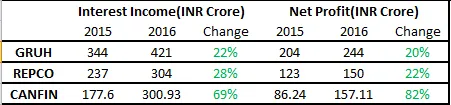
All three companies were growing more than 25% and even with larger base Canfin homes was doing better than other two
Next, I looked into bottom line growth, here again, Canfin homes was doing way better than other two
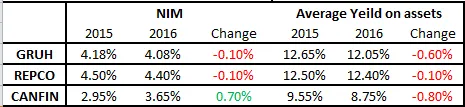
then I looked at margins GRUH and REPCO had far superior margins compared to Canfin homes, this could have meant few things
-
GRUH and REPCO had sourcing advantages (lower cost of financing) or
-
Better pricing power or
-
Better cost management or
-
Simply they were taking undue credit risk by lending to a riskier customer
It could be mix of all above factors so I started looking at net NPA, cost of funds and cost to Income ratio

For all three companies there Net NPA were similar so credit risk was managed well, None of them were expanding loan book at the cost of defaults by lending to a riskier borrower
GRUH and Canfin homes had similar cost of funds cheaper compared to REPCO and still, REPCO had better margins (NIM)
Finally, on cost management, the cost to Income ratio was best for GRUH(Expected on lines of HDFC which is best in industry) but it improved significantly for Canfin homes compared to last year.
So my summary was cost management was leading to better margins for GRUH, for REPCO there has to be some pricing power as their margins are better even when the cost to Income ratio is more than Canfin homes.
Finally, I looked at return ratio to review if there any key takeaways

Both GRUH and REPCO were sweating their assets well, remember a few percentage points difference, on an increasing loan book can make a significant difference to the bottom line.
GRUH has superb ROE (best in industry) and there was a significant improvement for Canfin homes. It was getting pretty late in the night so I plugged few valuations metrics for all three companies and shut my PC to pick this up later sometime.
What did I miss?
Canfin homes was growing at similar pace to GRUH and REPCO, its cost management was getting better its return metrics were improving and still it was priced 1/3 of GRUH and almost half of REPCO
My normal self would have dug deep to understand if REPCO had any pricing power but I relied on my first conclusion from numbers and remained steadfast on my positions
Today as I write this post in a year opening the same spread to update GRUH’s FY17 numbers
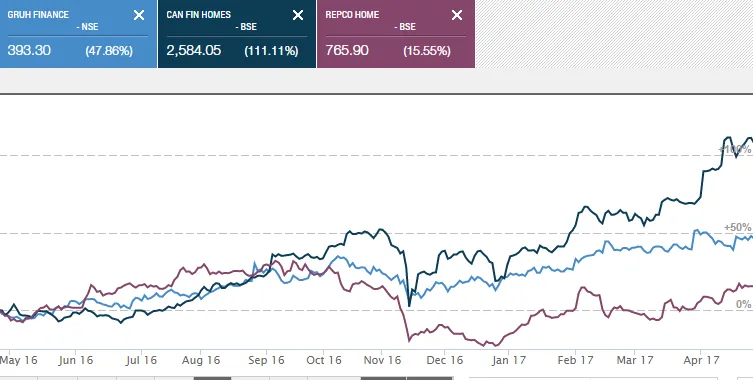
Canfin homes is up by 111% compared to 47% of GRUH and only 15% of REPCO.
This is a record of the author's thinking in April 2017, kept as written. It is not a recommendation to buy or sell, and the author may hold the securities discussed. See the disclosures.
Tankrich research on Can Fin Homes
2 posts from 2017 to 2017, oldest first.
- How I missed Canfin Homes (this post)
- Canfin homes - The out performance continues