Is it time to buy gold ?
Why this question and why now?
My views on investing in gold have been very clear, I am not a being fan of investing in gold. Although I am open to trade in and trade out
But being not a fan is one thing and understanding contradictory view points from experts who sit on the other side of fence is another and as investors when facts change we should change our mind.
Most returns in investing are cyclical as the below picture depicts
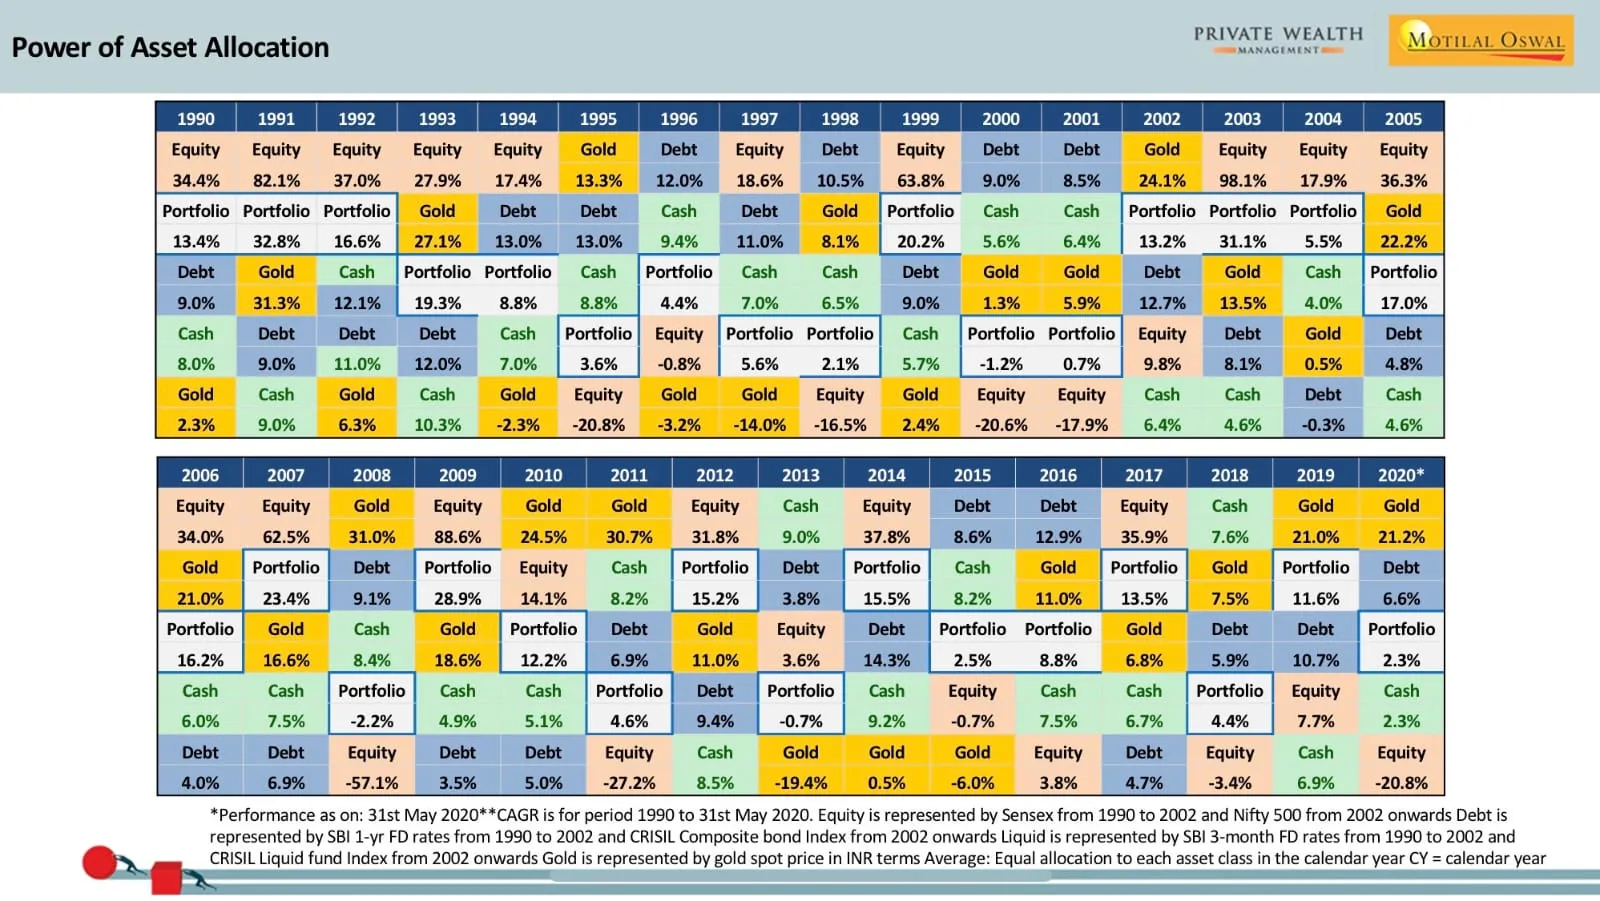
image source - Motilal Oswal
Even within an asset class the winners keep changing
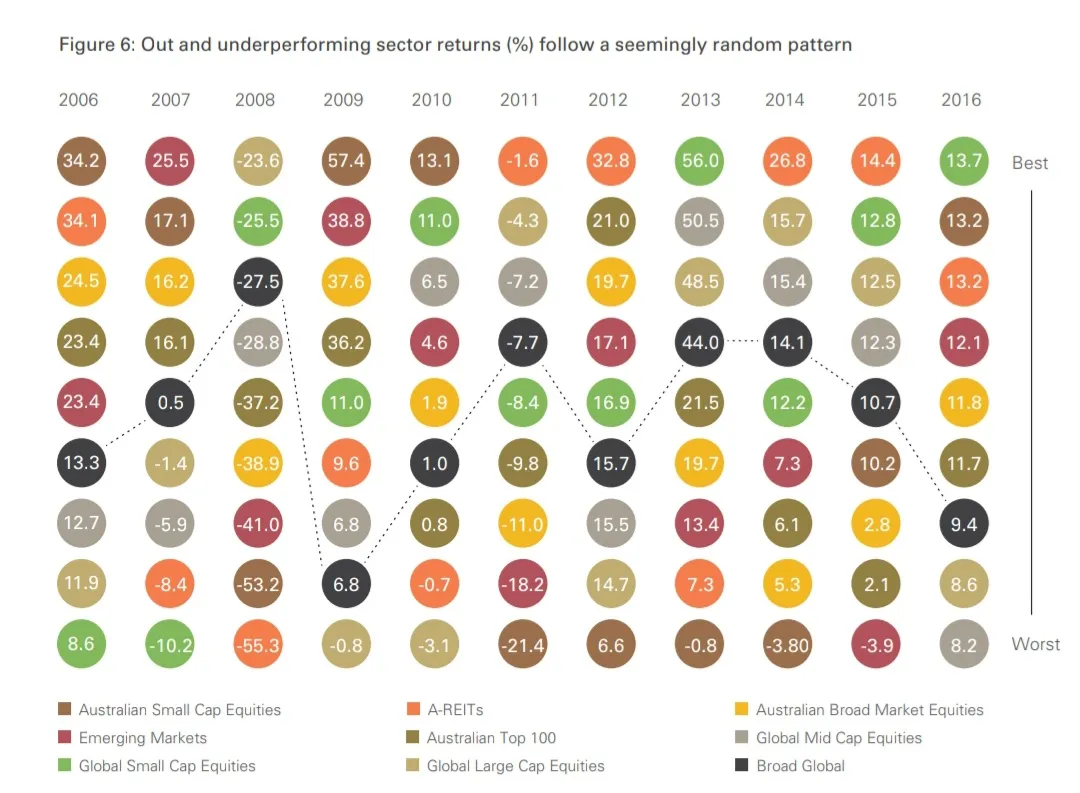
Image source - Vanguard Australia
Knowing above information, we know that timing can really improve one’s return. Many market participants would say time in market is more important than timing market. However there are small sub set of investors who have done well using rules to move in and out of asset classes
See below screen grab which shows results of timing and riding up cycles in stocks and gold
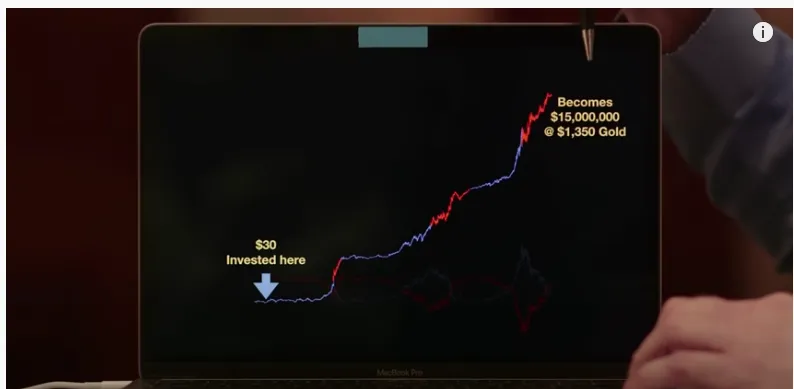
I think you should spend 15 mins to watch this full video from Mike Maloney to appreciate the concept
In what works on wall street Jim O’Shaughnessy points out that not challenging wisdom of market is a good idea
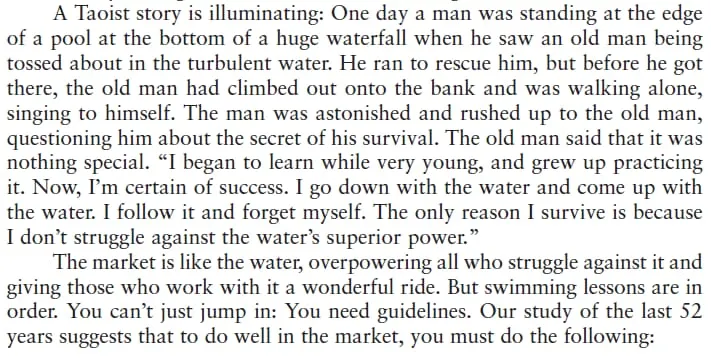
As a stock market participant its worth keeping a tab on how other asset classes are doing and I recommend you add below Dow to Gold Ratio to your toolkit
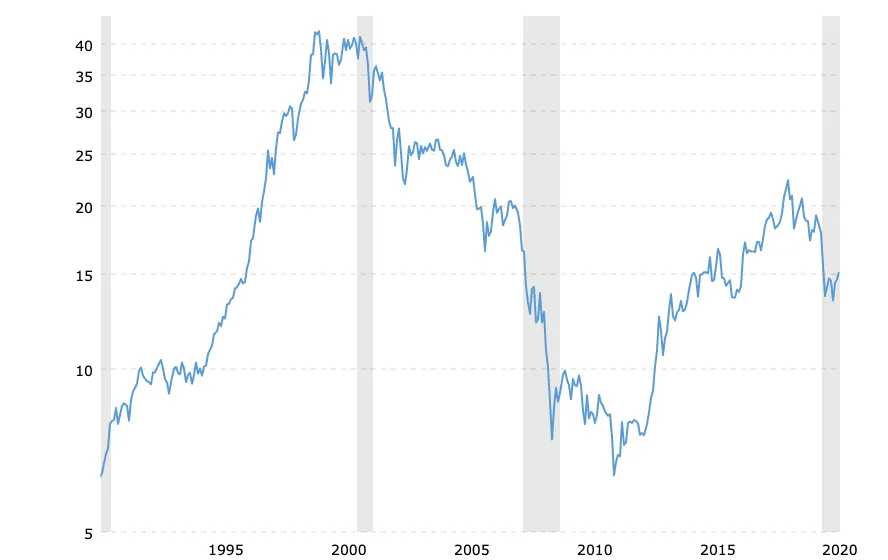
How am I using this?
-
Even though I may not buy gold by using above chart, it helps me time my ETF purchases (Index)
-
Historically 10-20%+ draw down is a very favourable territory for ETF purchases
-
Fed monetary and fiscal policies will mean that we may not see ever historical lows of this ratio like 2008, so may be reset the expectation to get in at 15 and not 10 in above chart