Historical Price to Book valuation of Nifty 500 stocks
Last week I was compiling how consistent wealth creators are faring vis a vis there 2008-09 prices.
I wasn’t the only one thinking on those lines, the guys at Ventura did even better and put together a comprehensive 20 year Price to Book Value of Nifty 500 stocks
Fantastic, you can download a copy from here (link now broken)
Some observations
1. Don’t do bottom fishing with 100 percent allocation, the price can go even lower if history is a guide
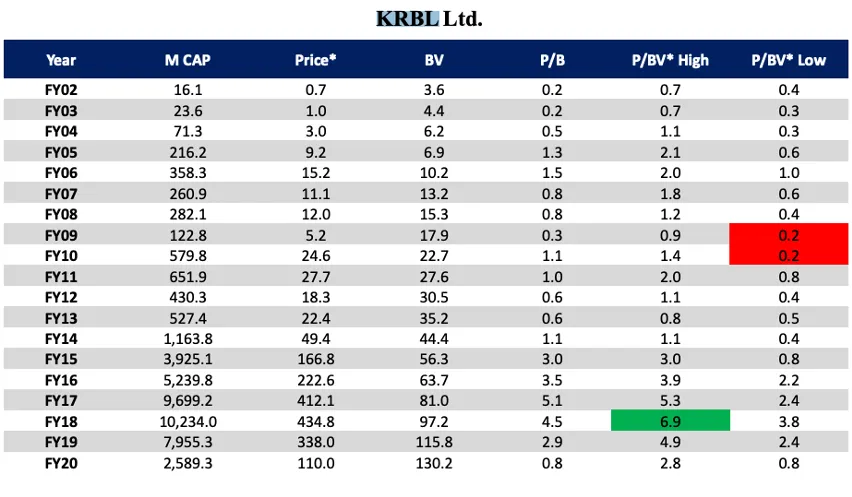
e.g. I was reviewing one the companies removed from scorecard KRBL P/B of 0.8 sounds cheap unless you see 0.2 in 2008/9
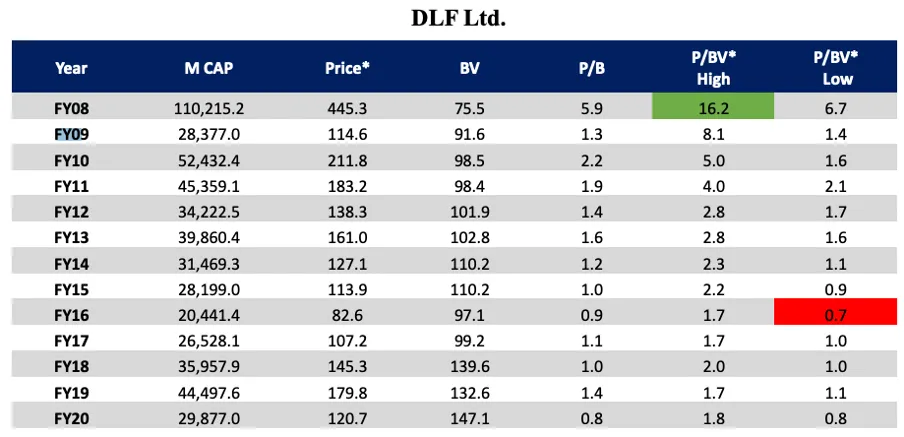
2. Don’t buy just because it’s cheap DLF market cap is the same today in as 2009 when it was statistically cheap as well
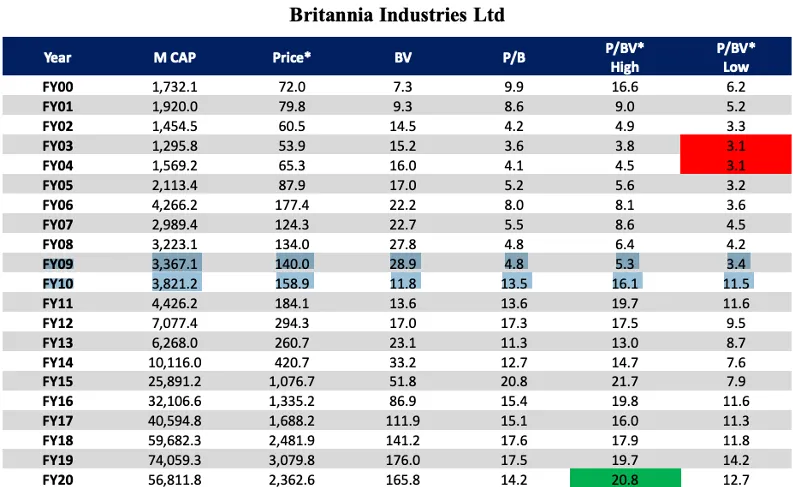
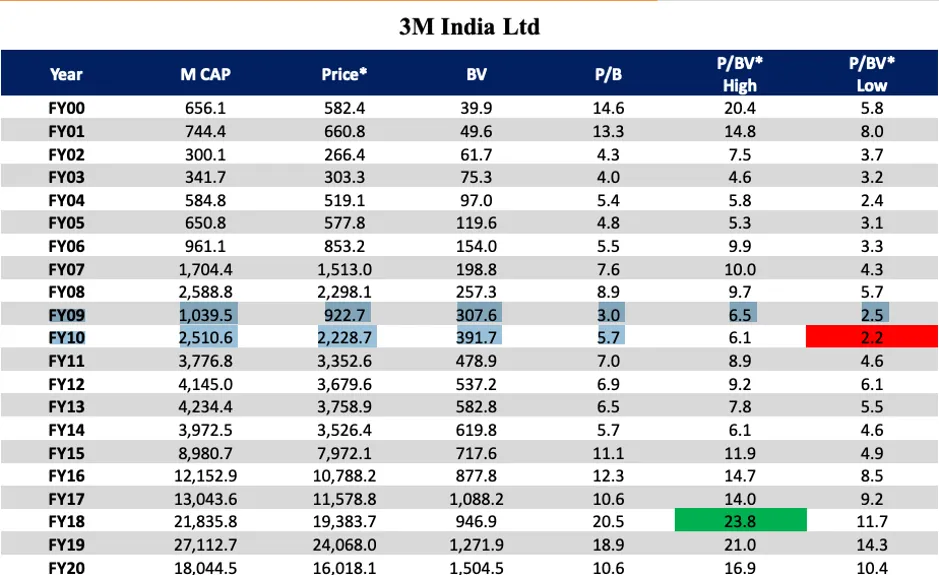
3. If 2008-9 was a guide the rebound can surprise you
Look at Britannia Industries and 3M India
The report also gives a sectoral view, will share some insights in a subsequent post.