BTC Course
In our BTC course for generating BTC signals I have added a different dimension - MACD-V
Why MACD-V
The “V” in MACD-V stands for Volatility.
Instead of looking only at price averages, MACD-V adjusts everything by how volatile the market is. Here’s why that matters:
-
Normalised View: You can compare signals across completely different assets equities, commodities, crypto without worrying that volatility is skewing the picture.
-
Smarter Zones: MACD-V tells you whether a move is healthy (Optimal), heating up (Elevated), or dangerously stretched (Extreme).
-
Signal Quality: Not all crossovers are equal. By layering in volatility, MACD-V grades signals into Strong, Moderate, or Weak giving you a sense of confidence before you act.
Think of it as upgrading from a speedometer that only shows “fast” or “slow,” to one that also tells you whether the road is dry, wet, or icy. The context makes all the difference.
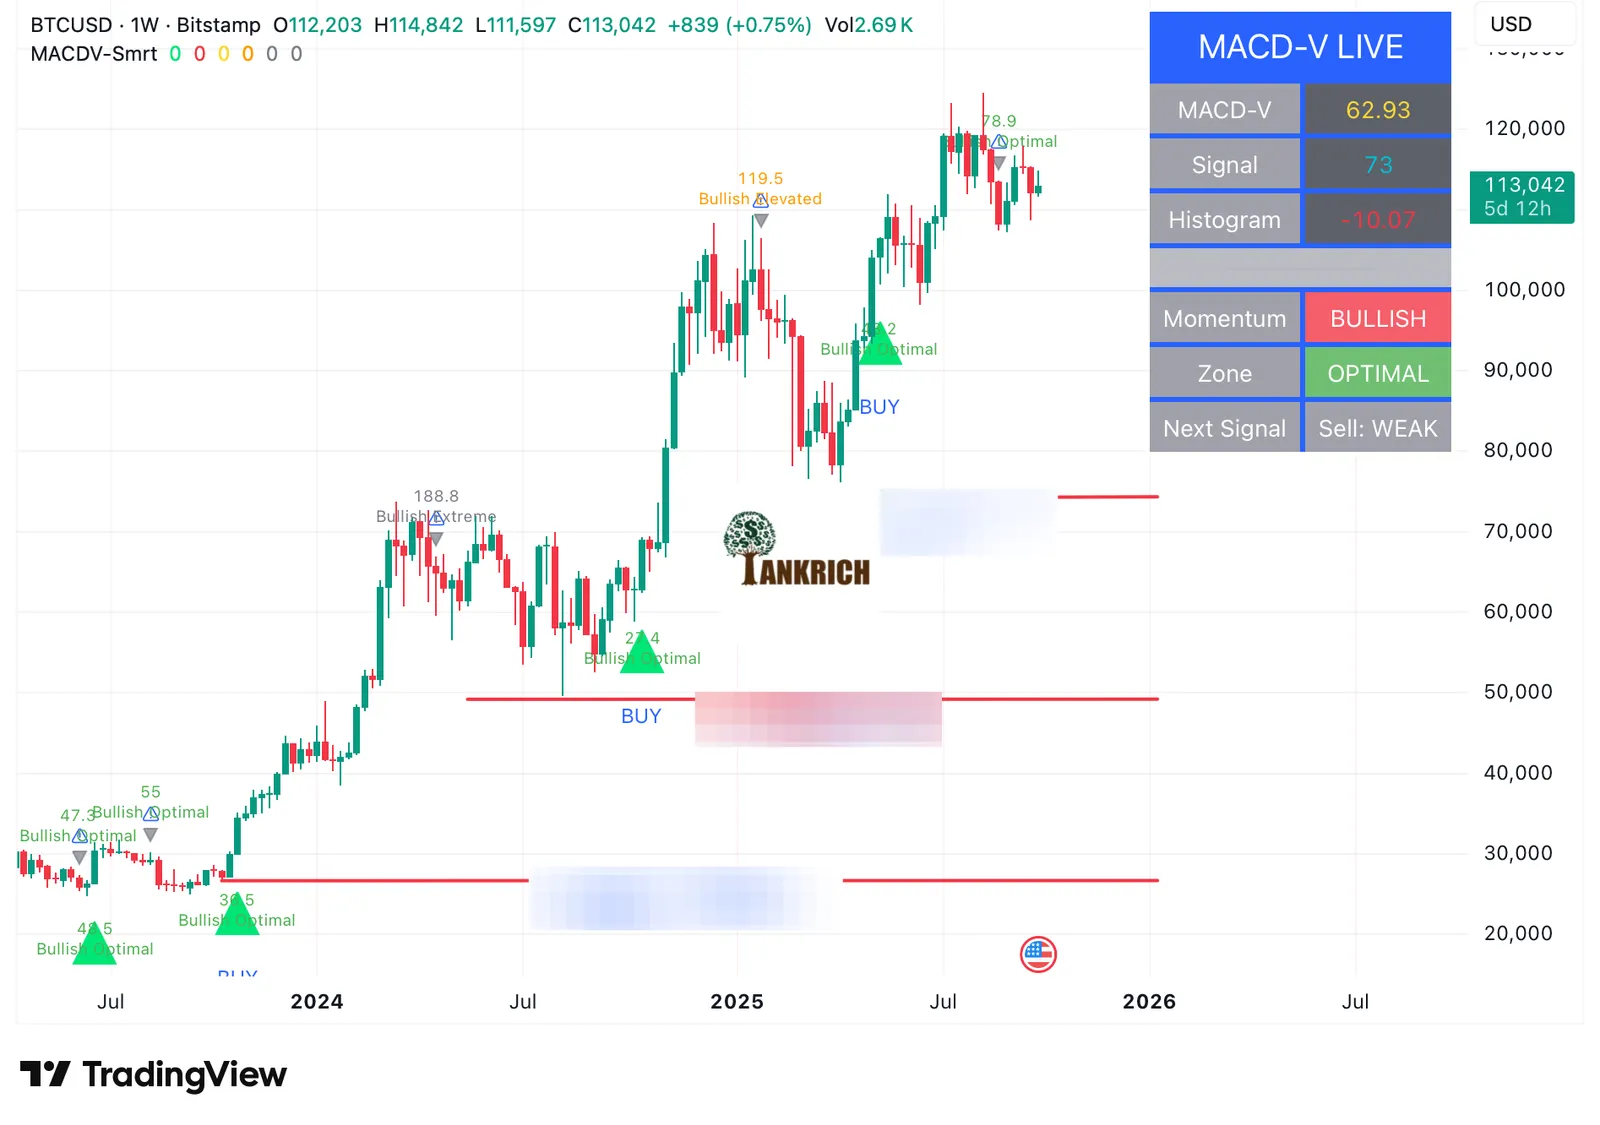
The visual display is like below
At its core, MACD-V does three things:
-
Measures Trend Strength
It still uses fast and slow moving averages to judge momentum, just like the classic MACD. -
Adjusts for Volatility
It divides the signal by the market’s recent “bumpiness.” That way, a big move in a calm market is treated as more significant than the same-sized move in a choppy market. -
Classifies Signals into Zones
-
Optimal Zone → Trend has room to run
-
Elevated Zone → Trend is strong but may be overheating
-
Extreme Zone → Trend stretched to the point of risk
-
Finally, whenever the MACD line crosses its signal line, MACD-V decides:
-
Is this a Strong Buy/Sell (clean, healthy setup)?
-
A Moderate one (tradable, but cautious)?
-
Or a Weak one (low conviction, easy to ignore)?
What the Dashboard Tells You
To make it even simpler, MACD-V comes with a Live Dashboard on your chart. Think of it as your cockpit display. It shows:
-
MACD-V Value → how strong the current momentum is
-
Signal & Histogram → whether the move is accelerating or fading
-
Momentum Side → Bullish or Bearish right now
-
Zone → Optimal, Elevated, or Extreme
-
Next Signal Strength → whether the next potential cross is shaping up to be Strong, Moderate, or Weak
This isn’t just for decoration — it’s designed to help you take action without staring at squiggly lines all day.
How to Use It in Practice
-
Look for Strong Signals
-
Green triangle below price = Strong Buy
-
Red triangle above price = Strong Sell
-
-
Check the Zone
-
Optimal = good risk/reward
-
Elevated = late stage, size down
-
Extreme = exit or avoid
-
-
Pay Attention to the Dashboard
-
If it says Next Signal: Strong Buy, you know momentum is lining up.
-
If it flashes Weak Sell, you can safely ignore the noise.
-
Get the full course, lifetime access