What's real drawdown
Stable Investor dutifully presents this drawdown page from peak on twitter
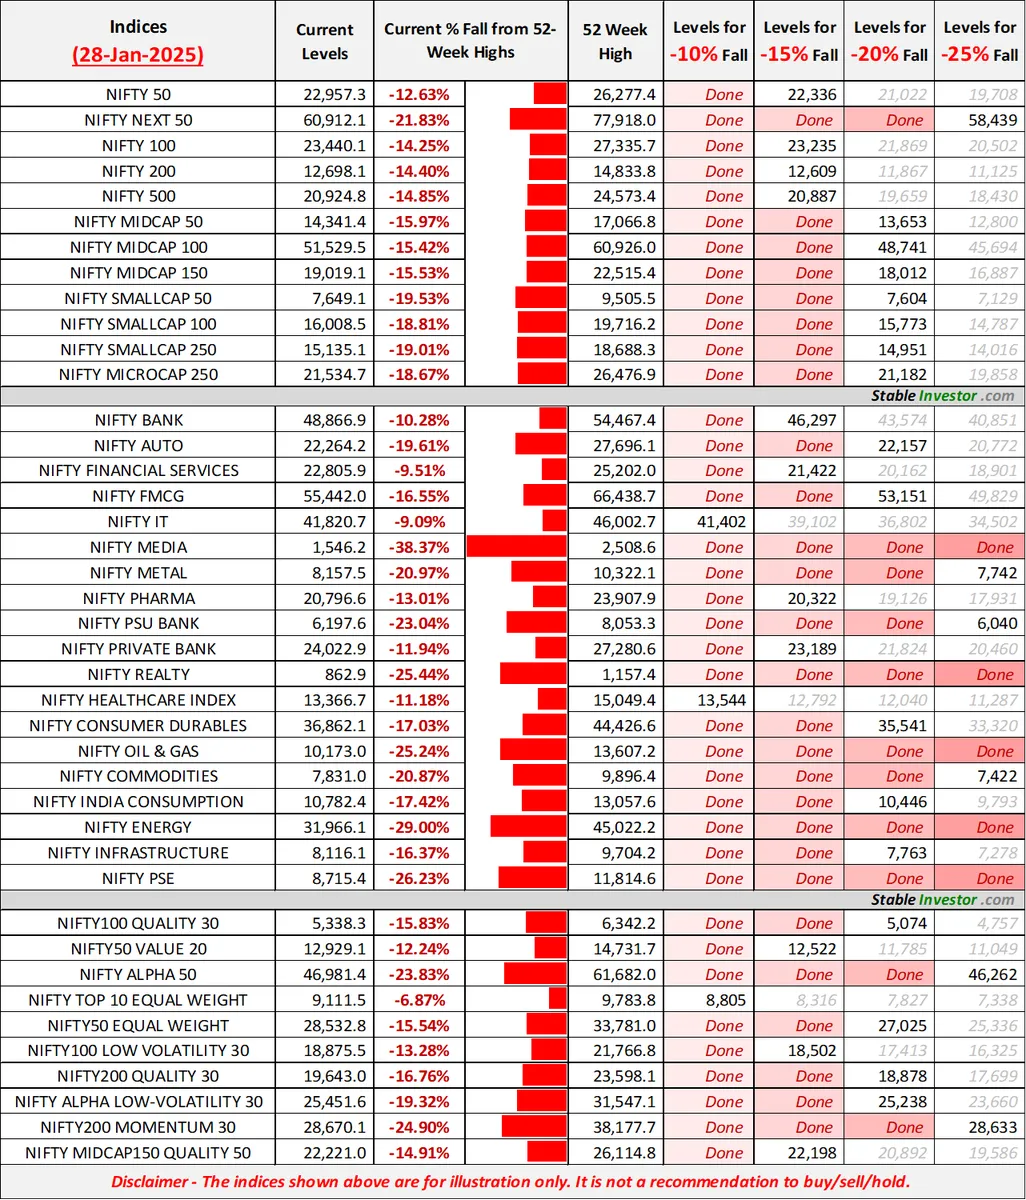
The average drawdown for Mid, Small and Micro Cap index is between 15-20%, however the indices hide pain of actual portfolio stocks. This post is reminder that drawdown is much severe. Here are select stocks from my own India portfolio
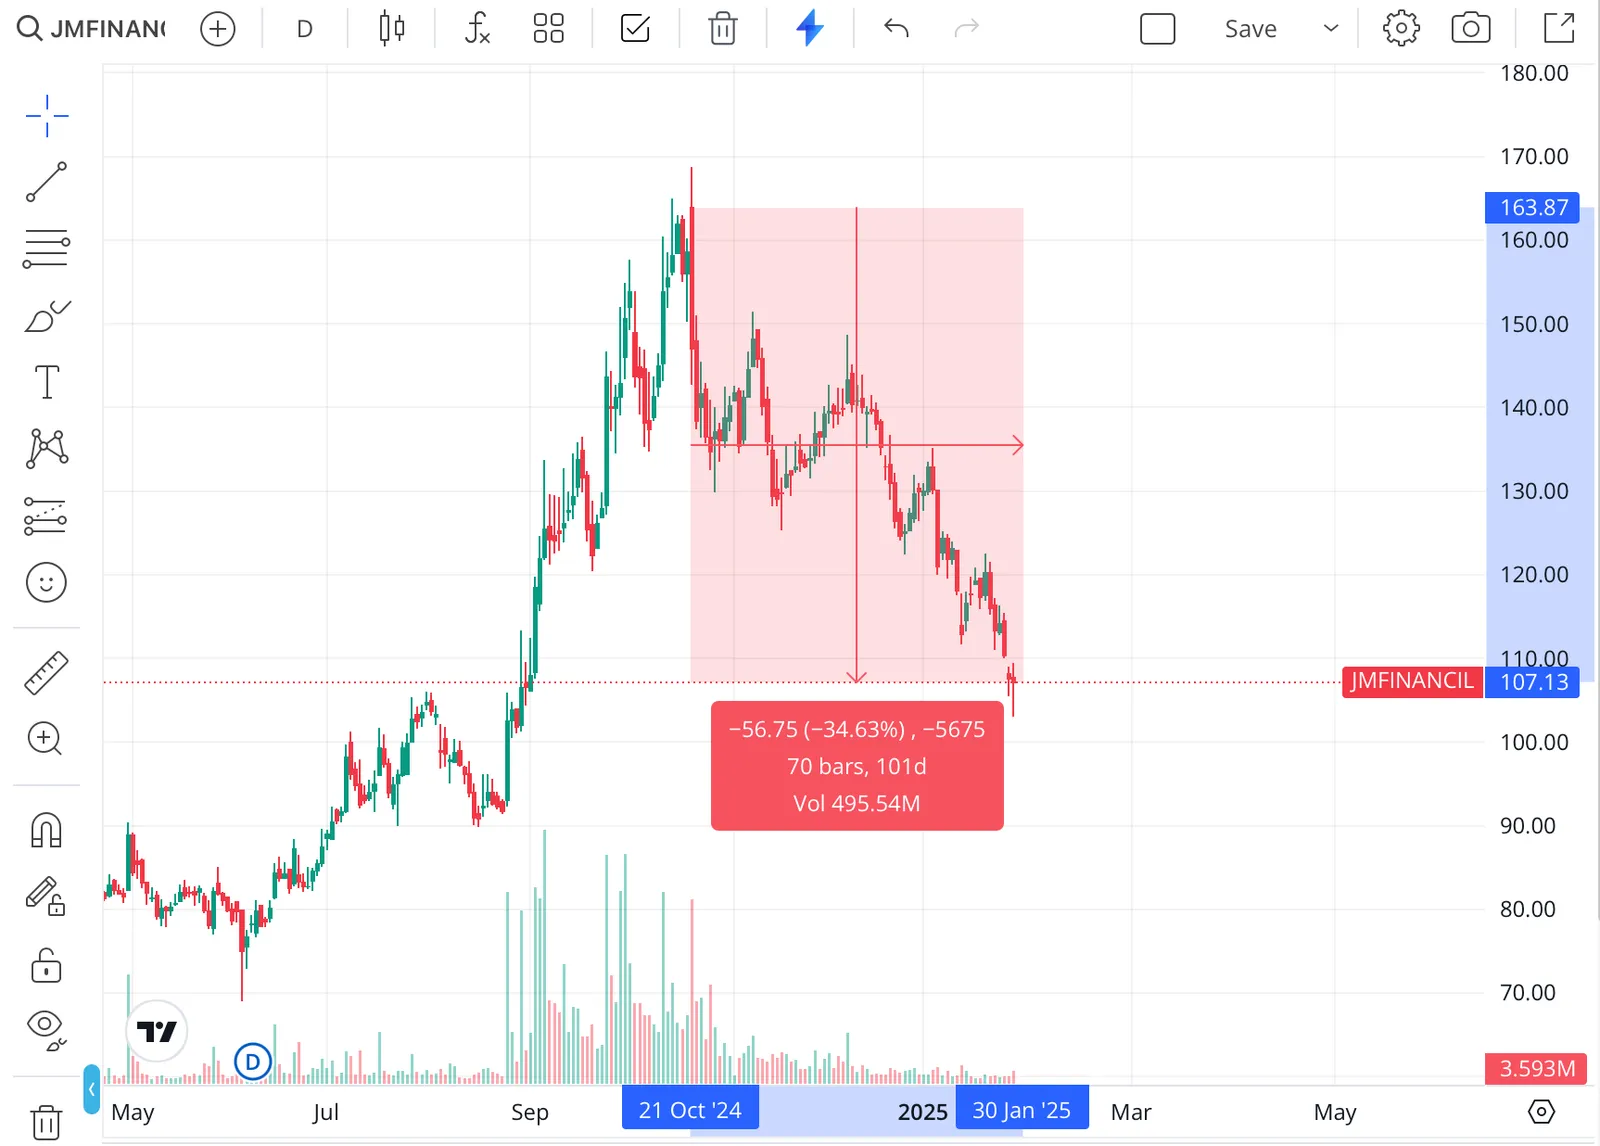
JM Fin
35% from peak
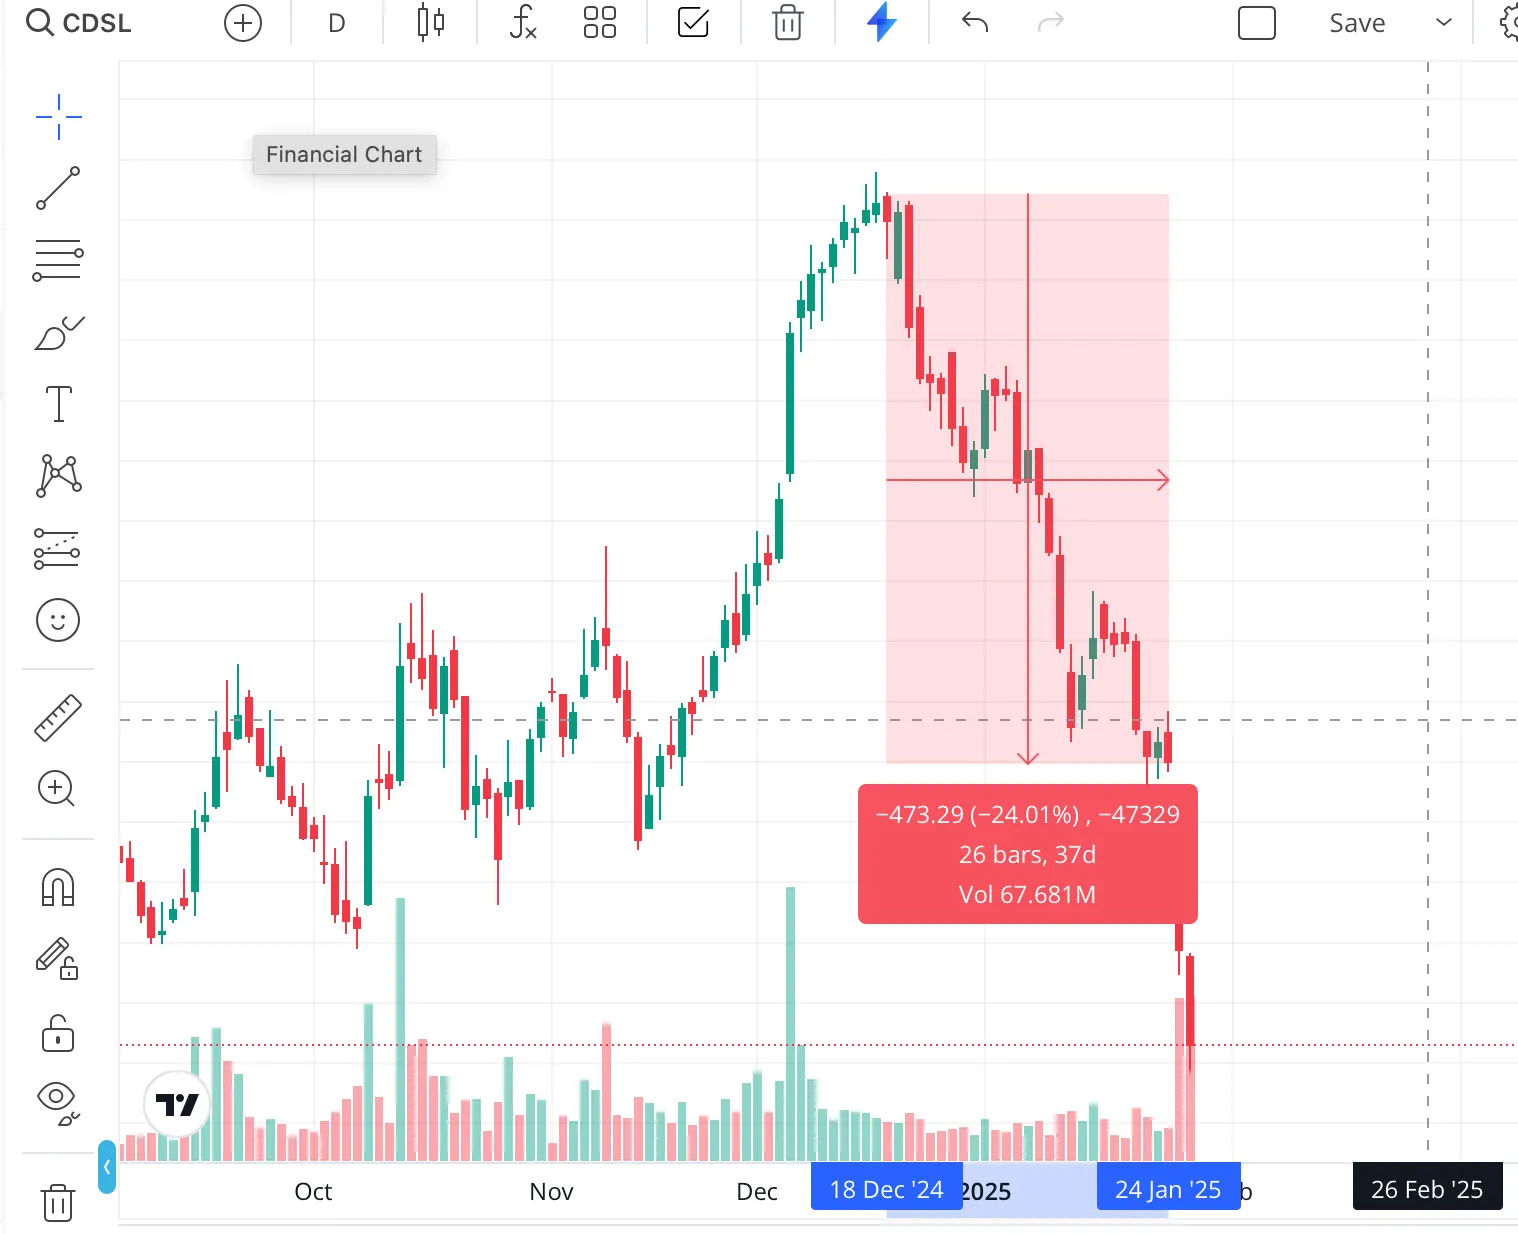
CDSL
24% from peak
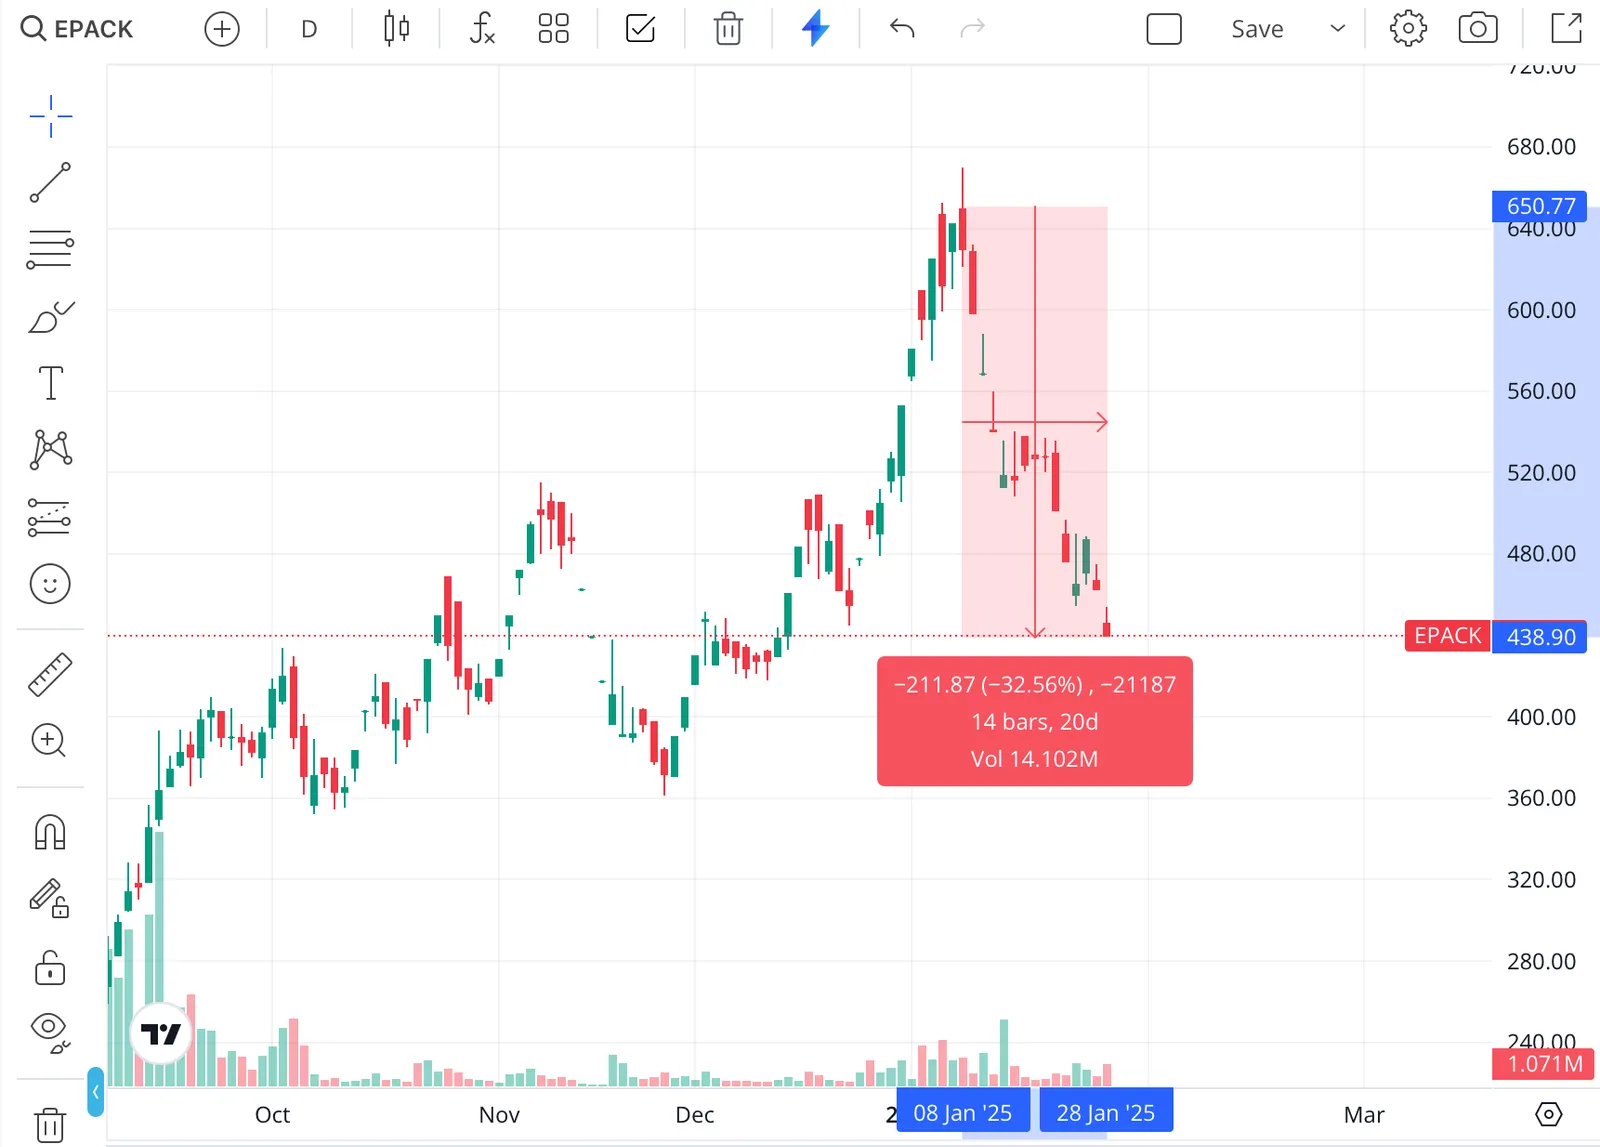
EPACK
32% from Peak
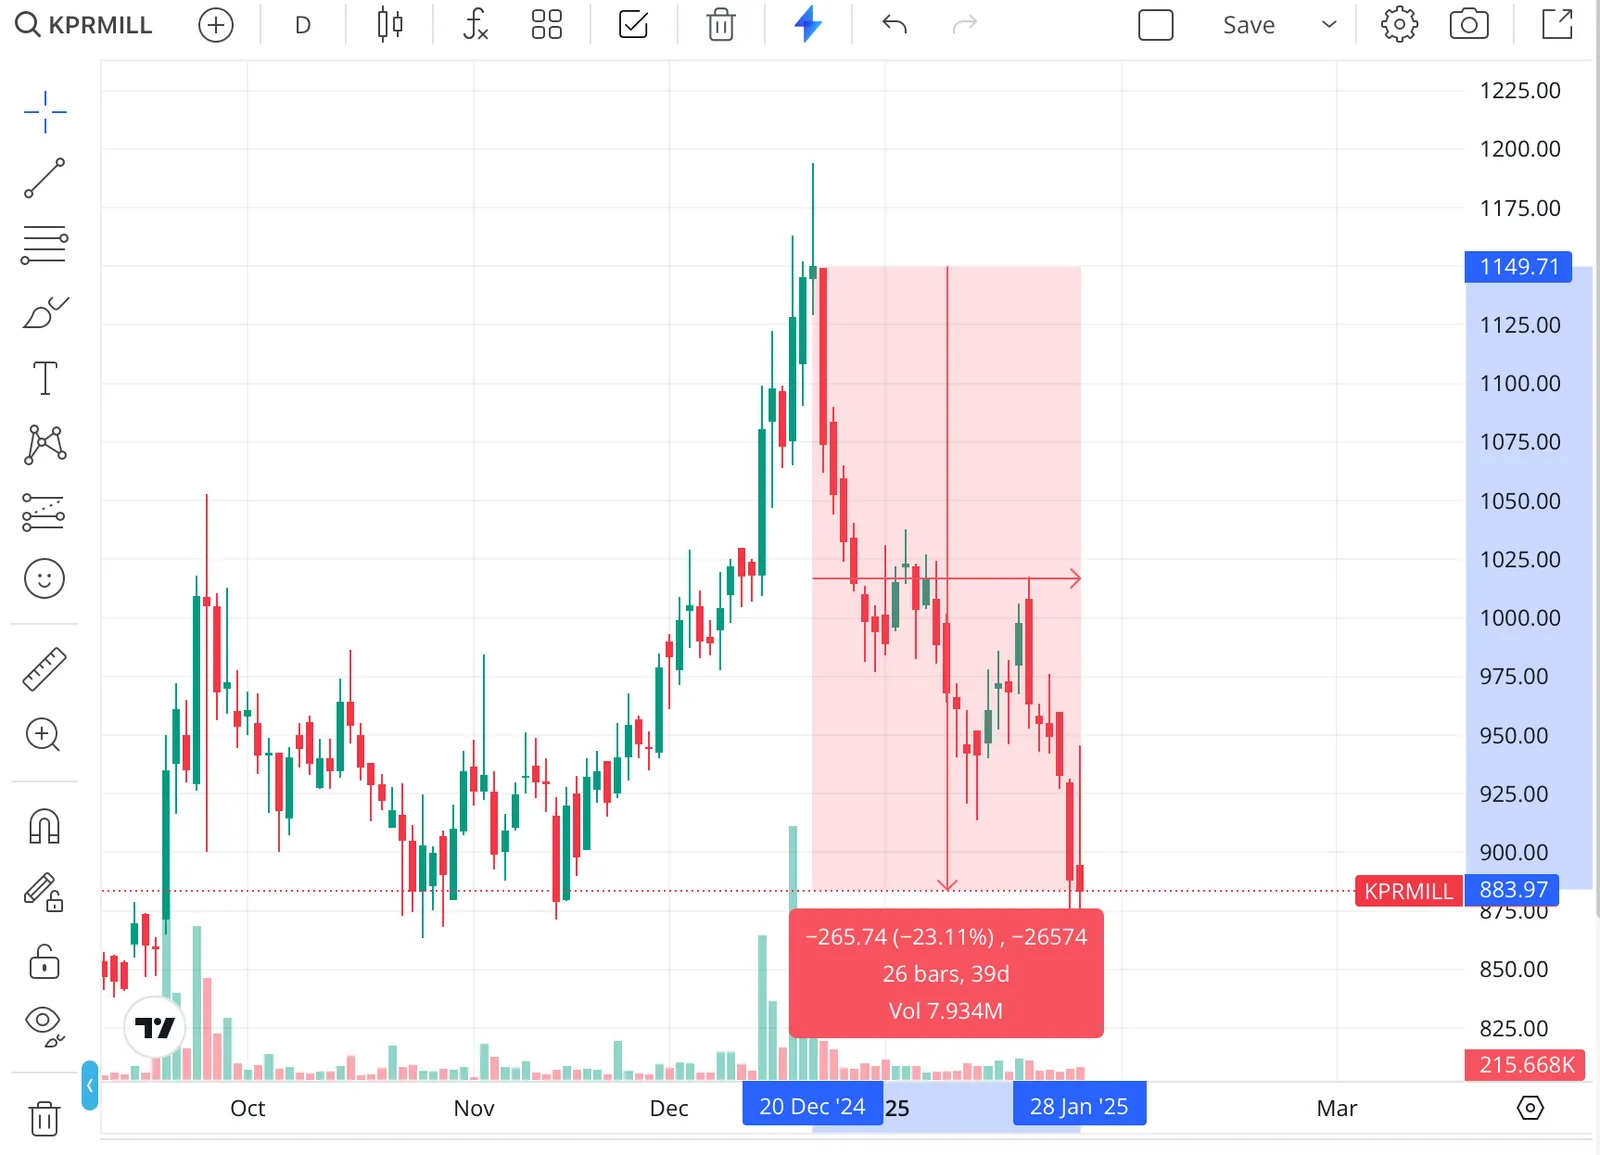
KPR Mills
23% from peak
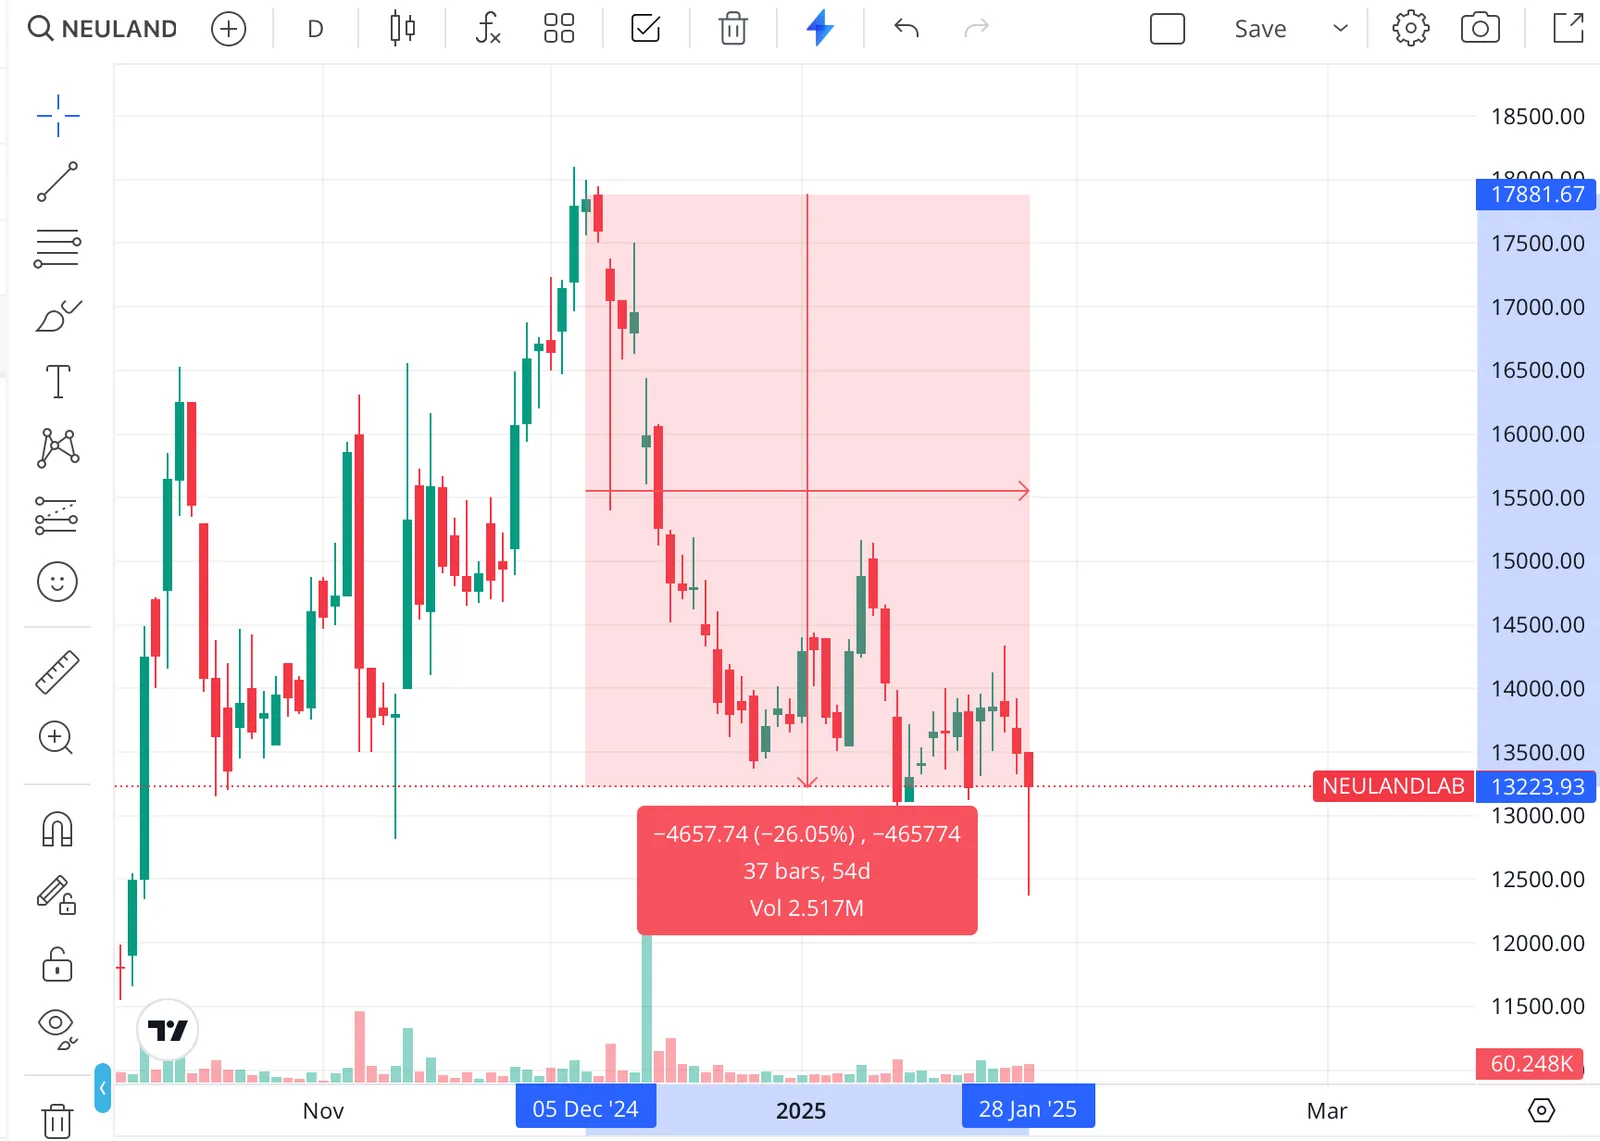
Neuland Labs
26% from peak
I have to quote my guru Munger
“It’s not supposed to be easy. Anyone who finds it easy is stupid.”
Market downturns are psychologically difficult, but enduring them is part of successful investing. Intelligence alone doesn’t prevent drawdowns; systems discipline is just as critical.
How do I cope drawdowns
-
Avoid daily stock watching it takes away pain although you need to reduce social media as well
-
Keep laser focus on business and 2-3 forward projections of invested companies, sell if things are too rosy!
-
Being honest to myself only liars catch true top and true bottom
-
Most importantly I am diversified across US stocks, Oz stocks and BTC (System driven)
Happy investing!