Timing an Index Fund
Passive index investing is gaining momentum (pun intended) among millennials. One of the questions that popped into my head
what would be better to buy an index hold or buy and sell using some easy-to-follow quantitative rule?
I ran some numbers
-
ETF - ASX VAS, Invests in Top 300 companies in Australia, It’s our version of USA S&P 500 or NIFTY 50 in India
-
Time Frame - Last 5 years
-
Strategy 1 - Bold and Hold (100 units)
-
Strategy 2 - Buy 100 Units if Current Market Price goes above Simple Moving Average (SMA 20) and Sell 100 Units if Current Market Price goes below Simple Moving Average (SMA 20)
-
The first entry is the same for both strategies
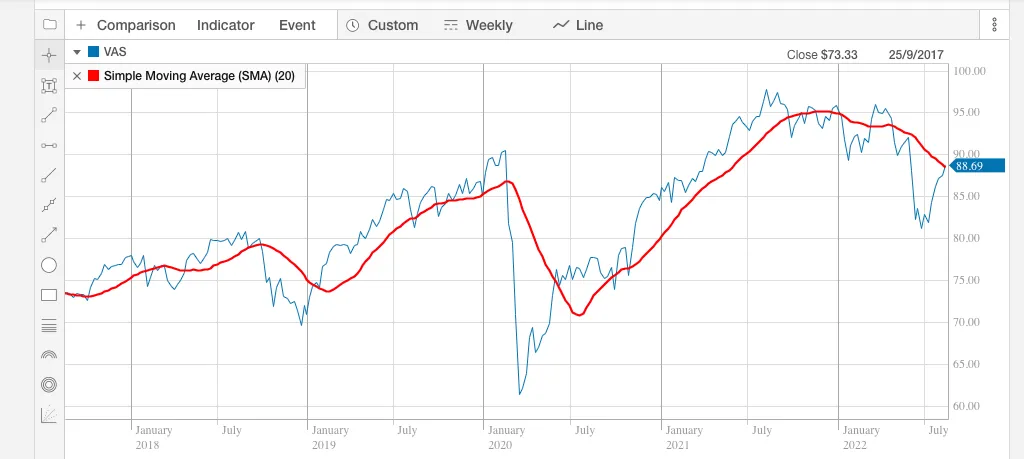
If you are a color person then every time the blue line (price) goes above the red line (SMA 20) you buy and sell if the blue line falls below the red line you sell
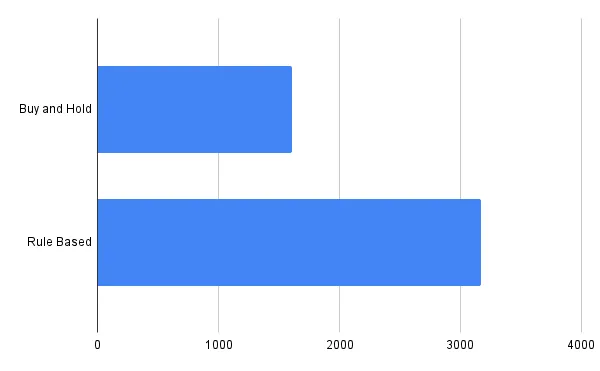
The initial results are unbelievable, Strategy 2 beats Strategy 1 by 2X
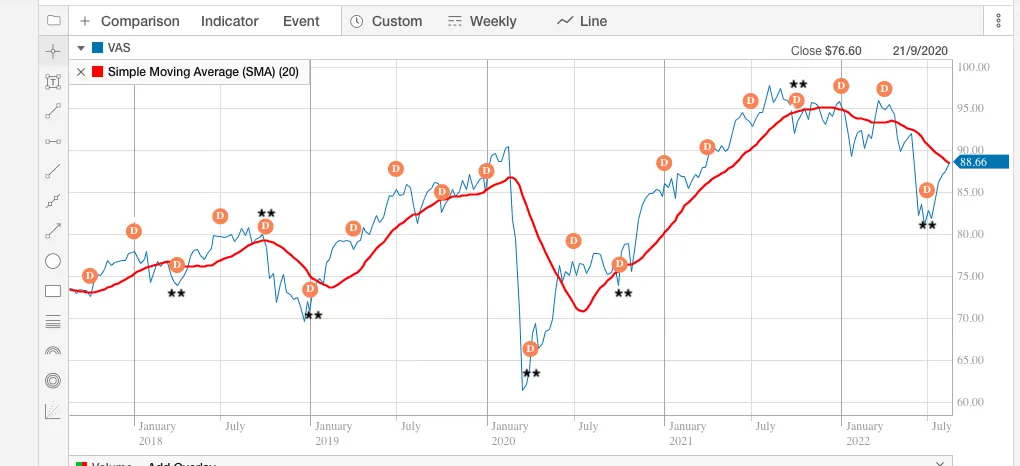
Also following this quantitative technique one can almost perfectly be saved from the covid crash. Given I was interested in the initial results I wanted to understand what would be benefits in real life implementation
VAS is a heavy dividend payer so one needs to account for dividends, as you can see from the below graph, Strategy 2 would miss on a few dividends (marked as **) as units would not be held
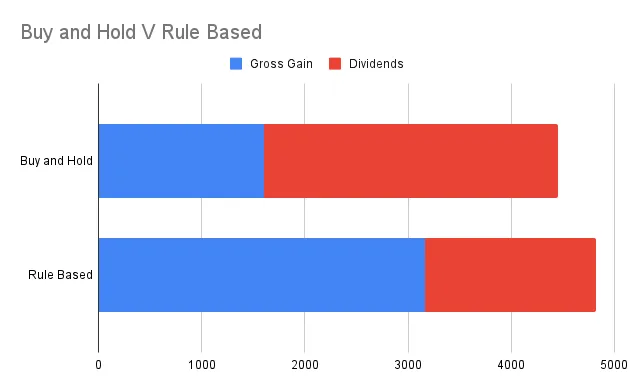
After accounting for dividends and franking credits (an Aussie-only concept) the lead shortens
What about transaction costs? Unlike USA / India where transaction costs are next to nothing. In Australia, even the lowest cost provider is relatively costly, The Strategy 2 has resulted in 22 transactions versus Strategy 1 which has only 2 transactions, this would narrow down the lead for Strategy 2
What’s missing in the puzzle? Taxes
The maximum time you held 100 units in strategy 2 was 329 days i.e. never qualify for the 50% tax rebate provided in Australia for long-term capital gains however in strategy 1 you held units for 5 years so we qualify for a 50% tax rebate
Not everybody is in the same tax bracket so I have taken three scenarios and in all 2 out of 3 scenarios strategy 1 beat strategy 2 , only if your tax bracket is lower (20%) does strategy 2 gives you overall minuscule gains
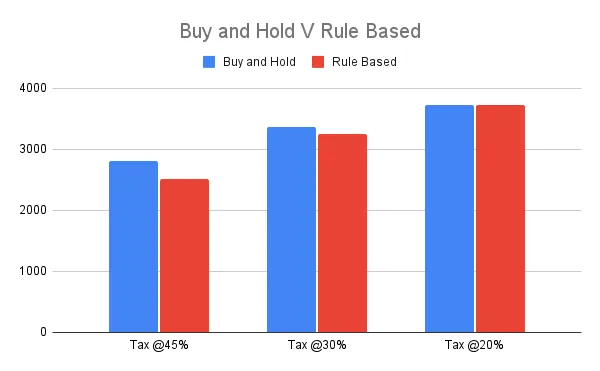
So what are the learnings from this exercise?
-
It is tough to beat buy and hold when it comes to index in Australia as the dividend yield is high and the tax regime for long-term holding (rightly so) is favorable
-
Using some basic quantitative measures can save you from big drawdowns and a lot of emotional toils
-
Never believe in studies that ask you to ignore transaction costs, dividends, or taxes as in real life they matter a lot!
While finishing this post the next question that popped into my head was - Can I use quantitative leads to improve my entries into an ETF?
That’s another exercise for another day, subscribe to get emails alerts whenever I post content, to get raw workings for this post you can them here on this sheet
happy investing