Easy way to beat dollar cost average
Family & friends extensively use dollar cost averaging to invest in equity markets , in mutual fund industry in India its also called as SIP or Systematic Investment plan. It has proven to be a very successful method to build wealth in equity markets.
I am proposing in this post a method that would super charge your wealth creation journey, Its called DCA+
How to practice DCA+?
Two simple steps
-
Don’t change your SIPs or DCAs continue them
-
When you identify DCA+ investment zone on a chart, investment a lumpsum (if available) into markets
Now what are DCA+ indicators, 2 simple ones identify when
-
Markets are down 10-25% from its most recent peak or
-
Markets are trading below its long term (10 year) trend line
I have created a simple diagram to show them
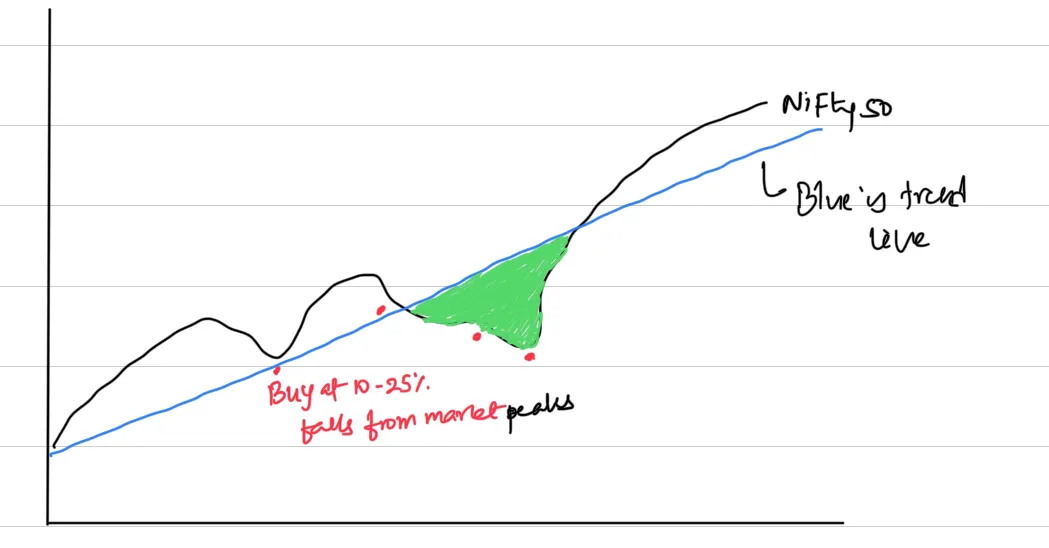
In above diagram
-
red dots are points where markets have fallen between 10-25% off its recent high
-
green shaded area indicates market trading below trend line
Investments during these times super charge your SIP results.
It’s easy to do this exercise with plethora free tools and alerts available today. lets look at a real example step by step
-
go to trading view
-
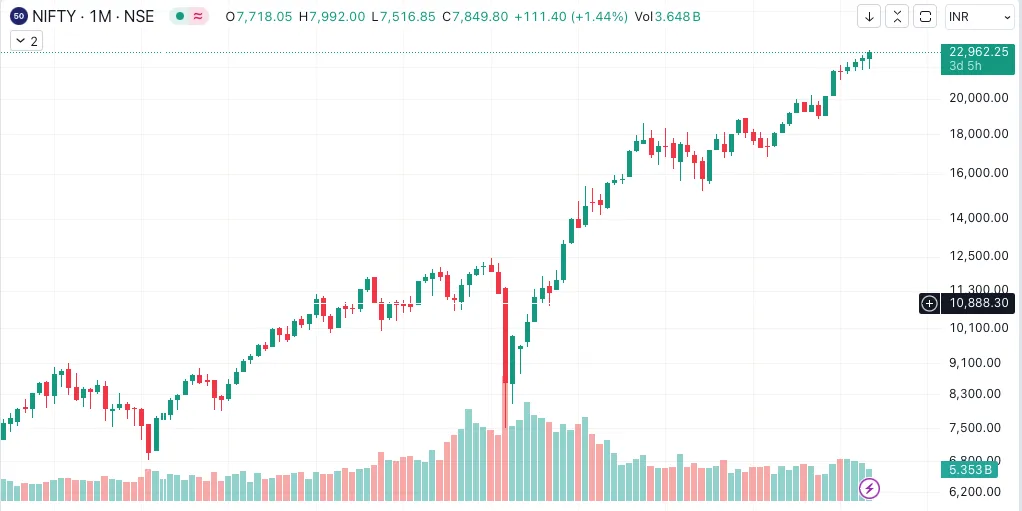
Launch nifty 50 chart monthly chart for last 10 years
-
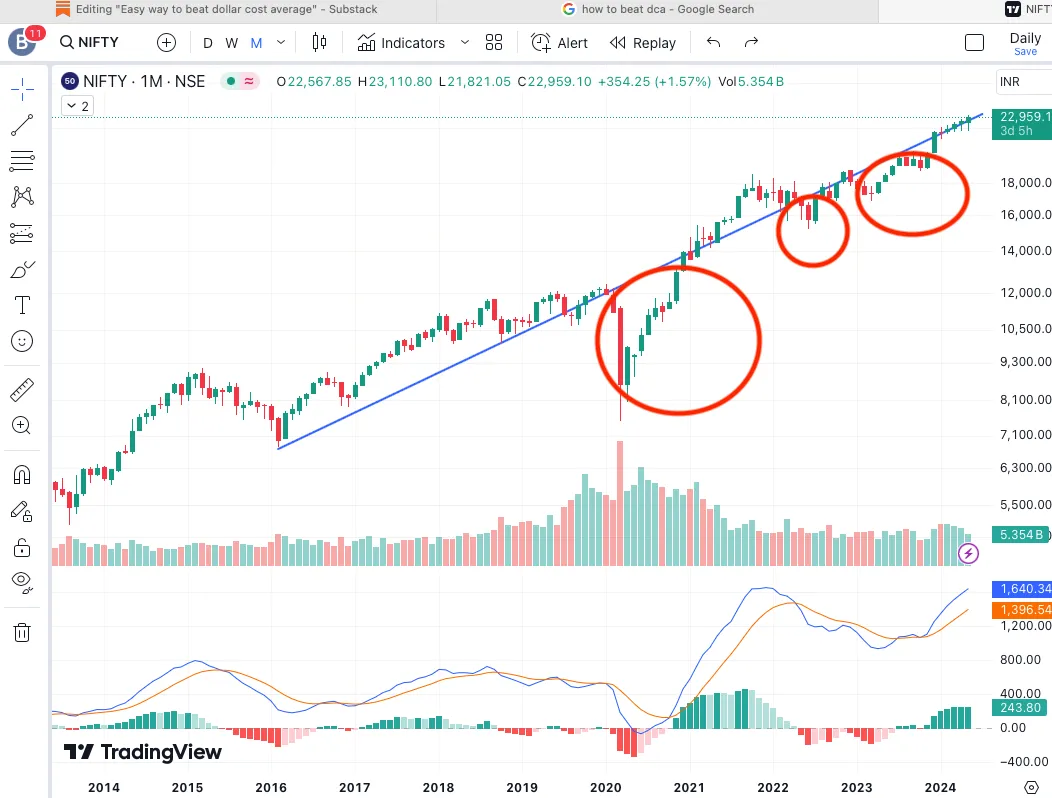
take bottom from in this example from 2016 and draw a trendline (45 degree)
-
Check if market is below this blue tend line if yes? good to do lumpsum in your nifty 50 , if no then just continue with your regular SIP
-
The red circles are months when DCA+ will super charge wealth creation
-
Finding when market is below 10-25% high is even more easier these days with technology ,set them up in brokerage apps or chat trading software
-
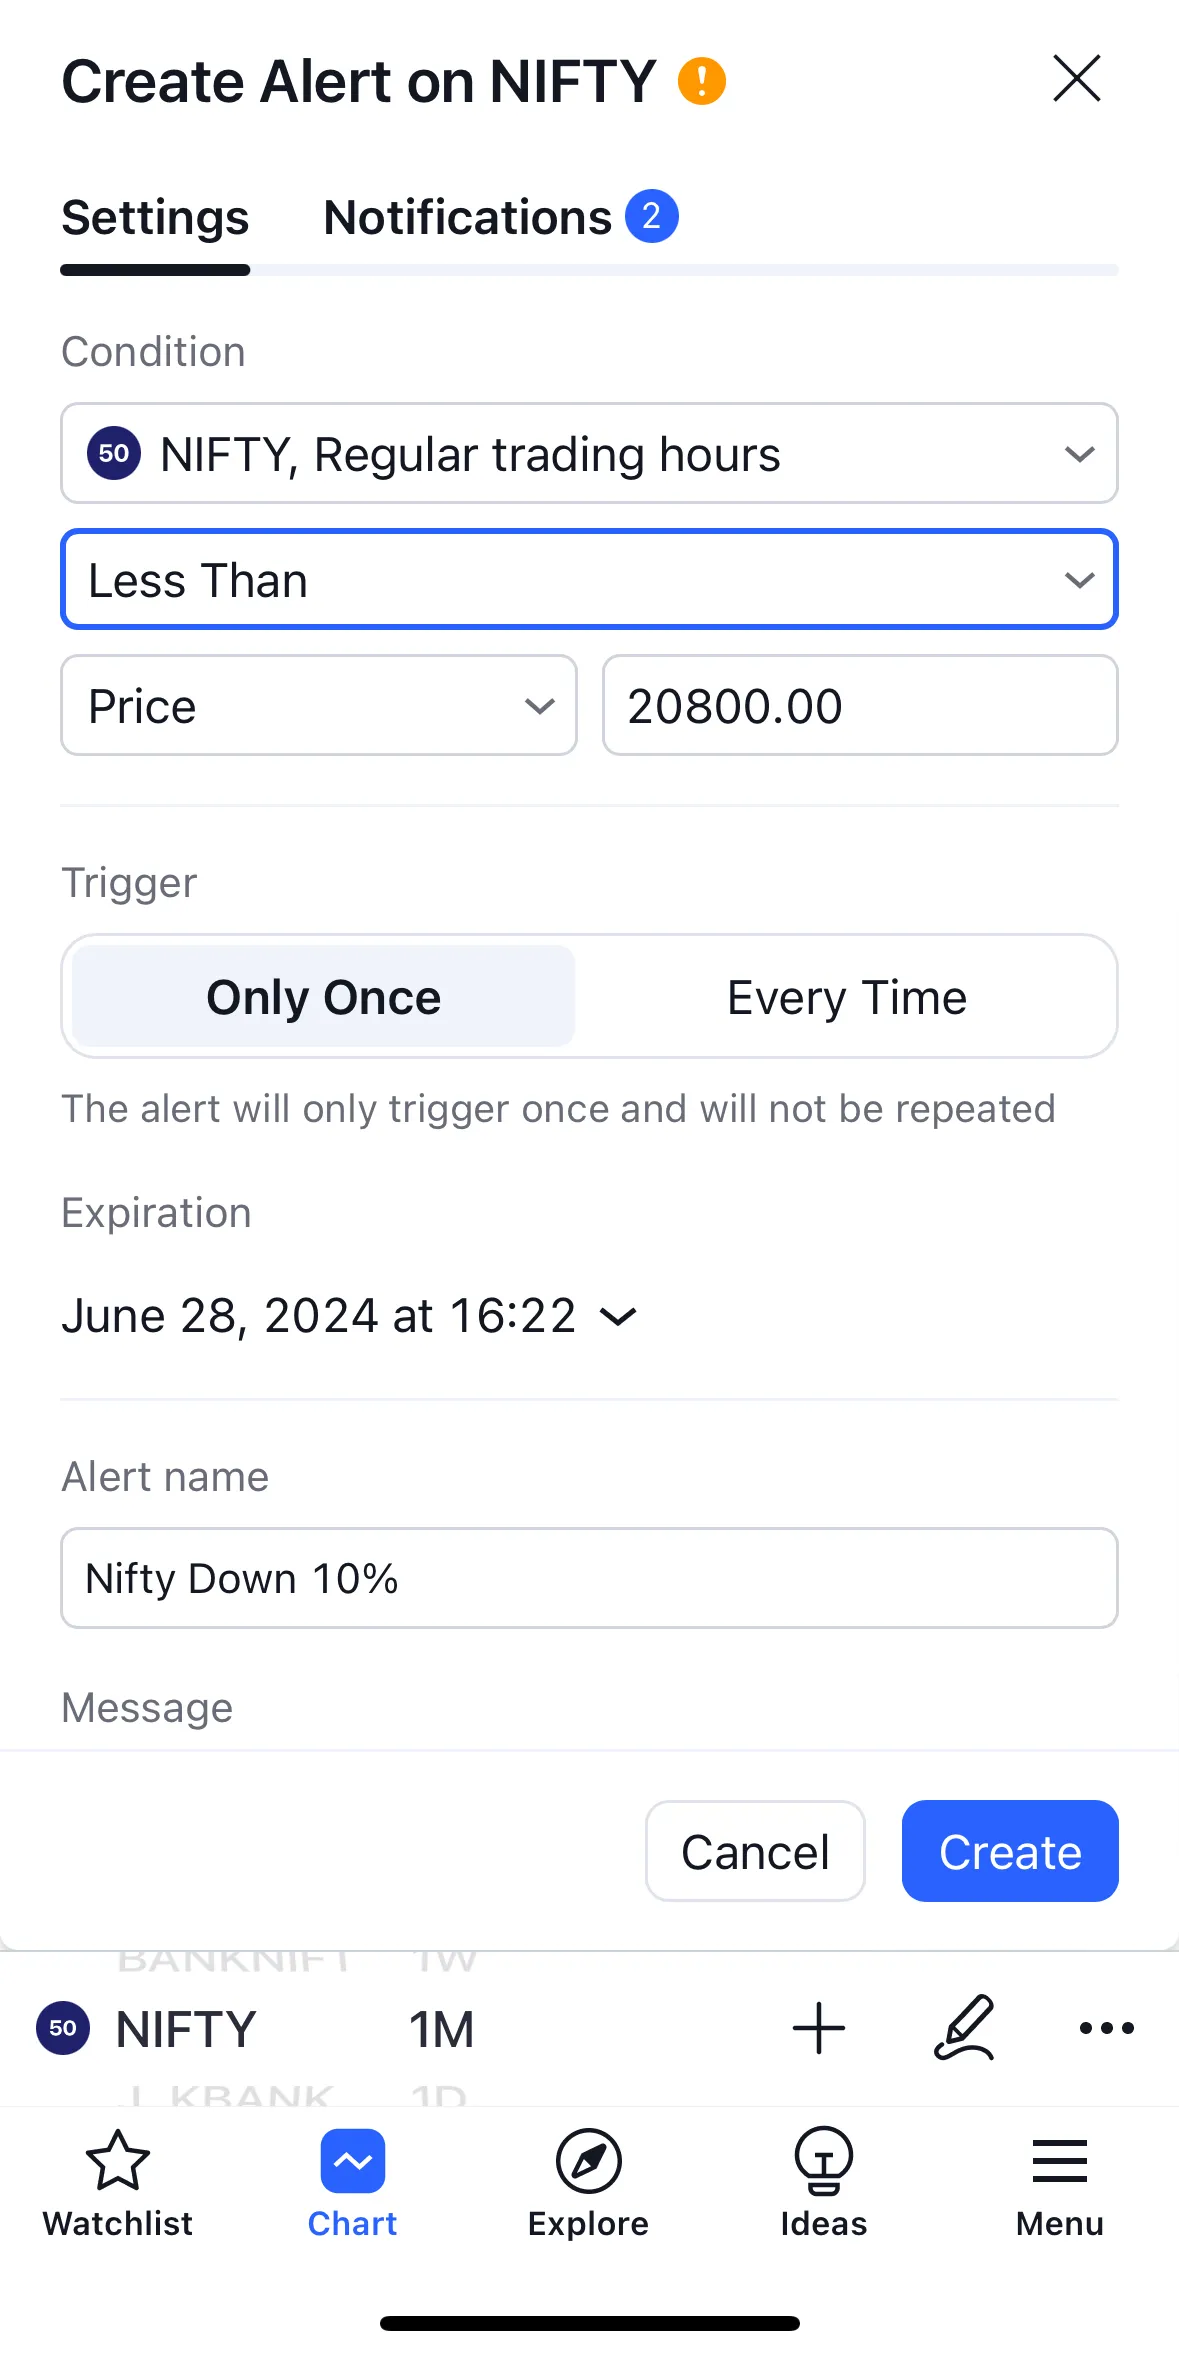
Here is simple alert I created on Trading view for Nifty 50, I looked up recent 52week High and multiple it by 0.9 to get levels were DCA+ is applicable in our example it would be 20800
-
Just set an alert to email you if market goes below 20800 and you are set
-
to get an alert from the app (trading view)
you can use this method for any Index, Mutual Funds, market cap weighted broad ETFs but not individual stocks
Please don’t use this for individual stocks its not useful
Happy Investing