Internet Companies Dashboard
A few weeks back we published, Internet Trading Indicator, using this logic I wanted to track best 100 internet companies in less than 15-30 mins over weekend.
We made some improvements to the dashboard, a new analysis tab has been added to the sheet. This provides a weekly view of
-
whether a new momentum is detected in one of the 100 companies - Green cell colour
-
whether momentum persists - no change to cell colour
-
whether momentum has faded - Red cell colour
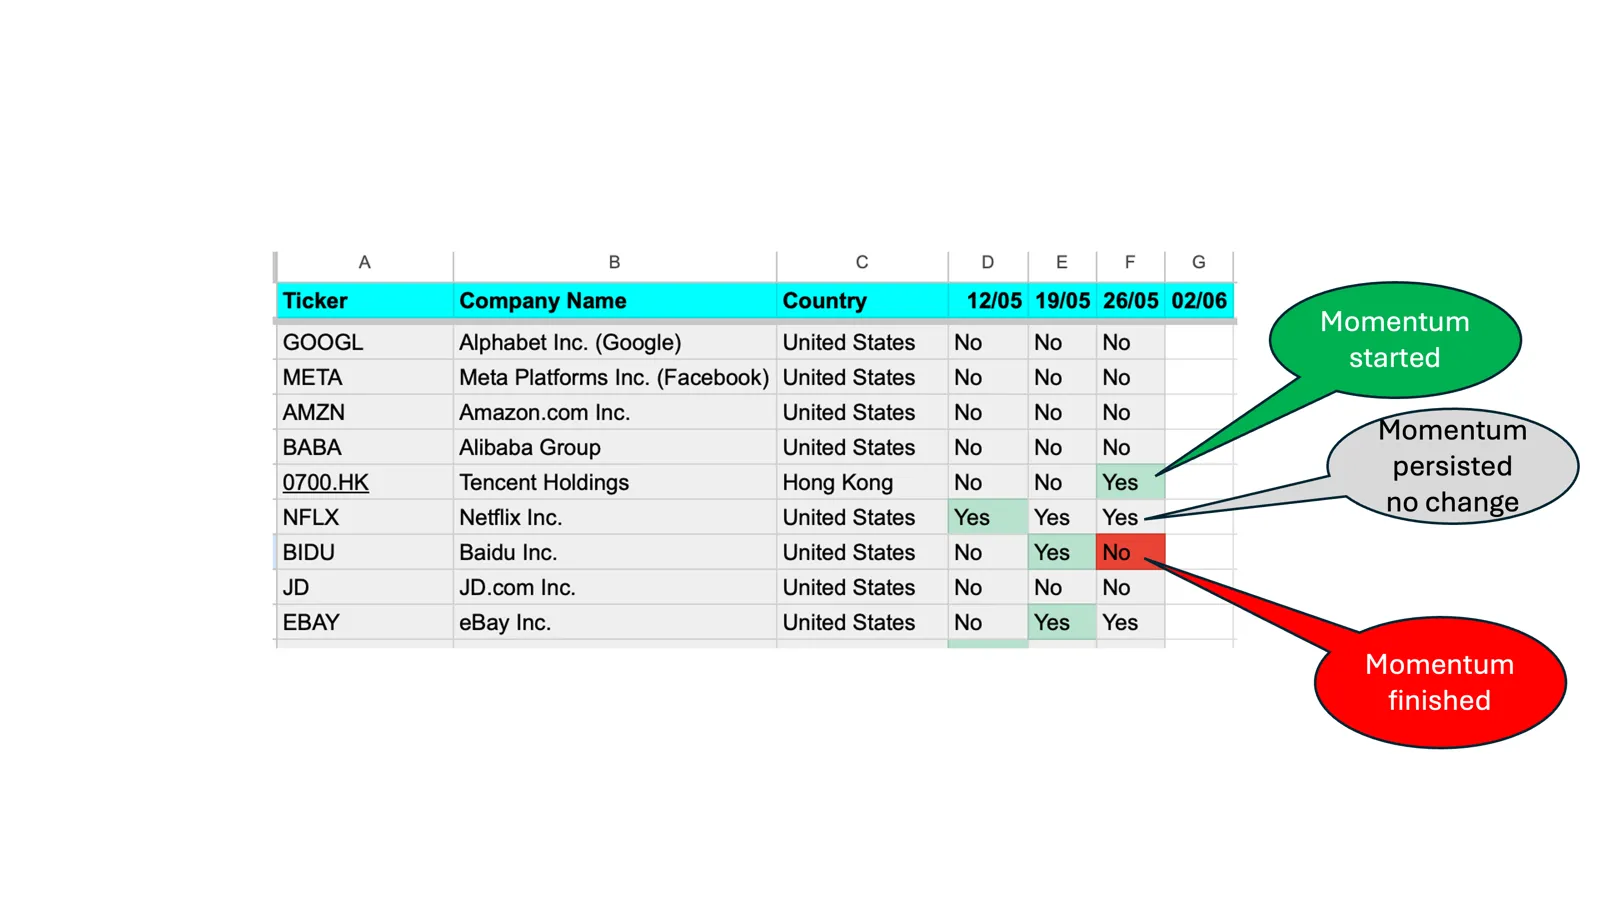
This help is quickly identifying what new companies have started to appear on this list vs what has faded in momentum and helps to take positional call on Mondays
In this post I will take you few hypothetical examples on how this system can be used
Netflix
in May our indicator turned green on Netflix
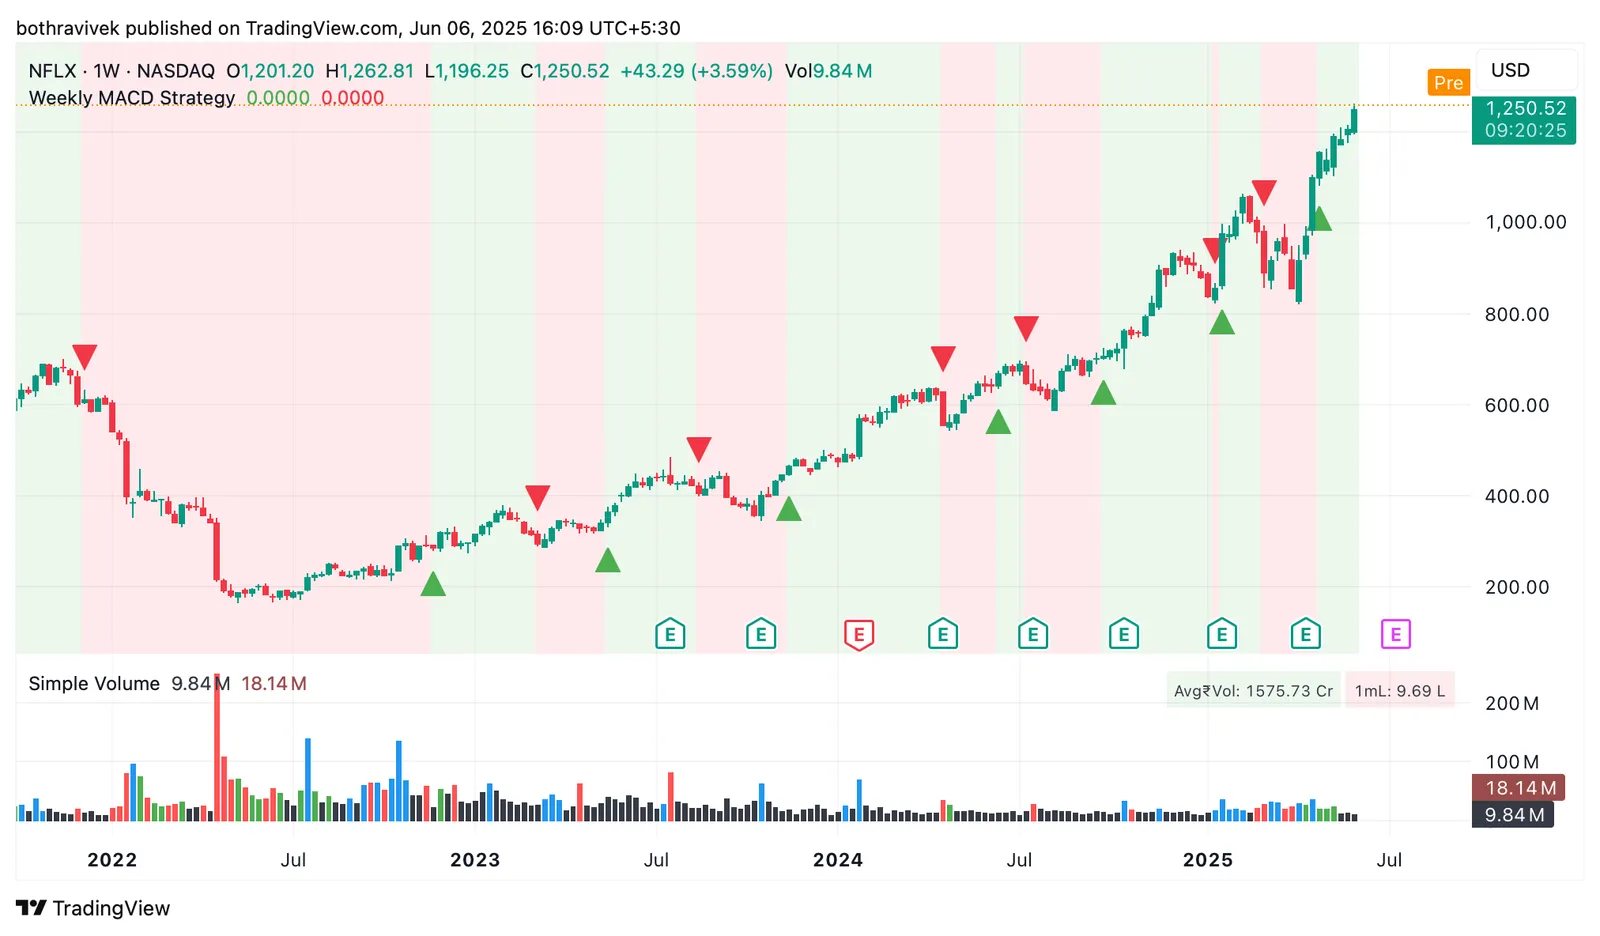
Very likely this was on back of good earnings without knowing anything on earnings terms price action in earnings week tells us that earnings were ahead of market expectations
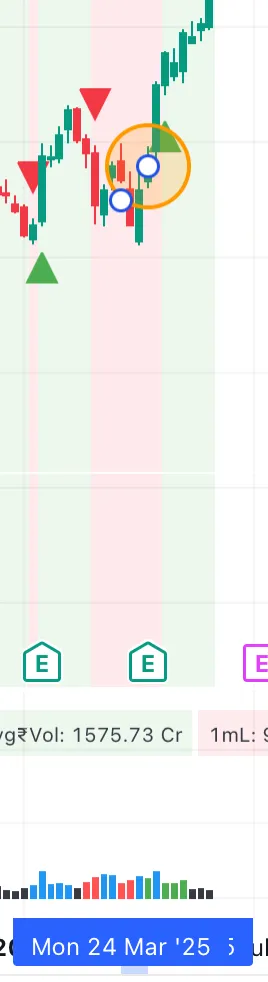
My experience surprise earnings driven switch can go either way, so I will check for few more things
1 - General uptrend in stock - Yes, with decent volumes
2 - Buy close to top of the wick but not hugely above so in Netflix case around USD $1095
3 - Wait for indicator to turn red to sell
Trivago
Trivago was another company that turned green in may but faded quickly
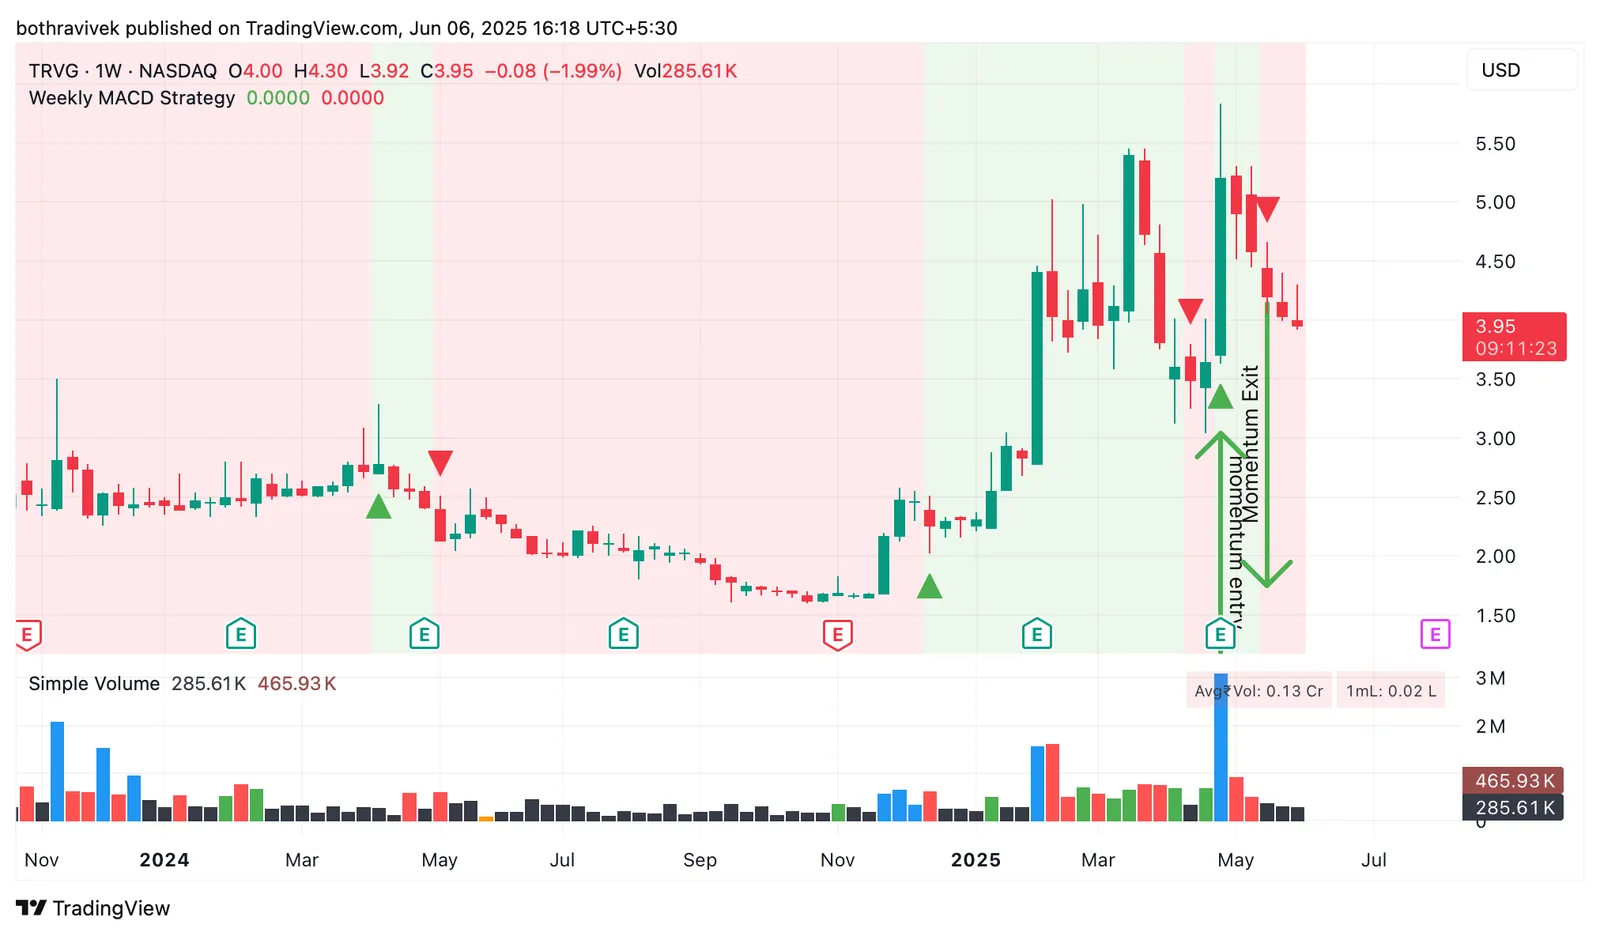
Another one which turned green on earnings release, good volumes but see few things
-
The company has been on upswing on broader horizon so thats fine, however check the wick of green week shown above as momentum entry , it had such a long wick which means sellers sold and push week’s high down
-
The prior green triangle in late 2024 was one of best entry , we got signal on a red week , few weeks of basing and then huge jump, that trade would have done 50% in 3-4 months
-
For me this is a lower quality set up and I would wait for price to consolidate and show strength before I go in
thanks for asking
NYKKA
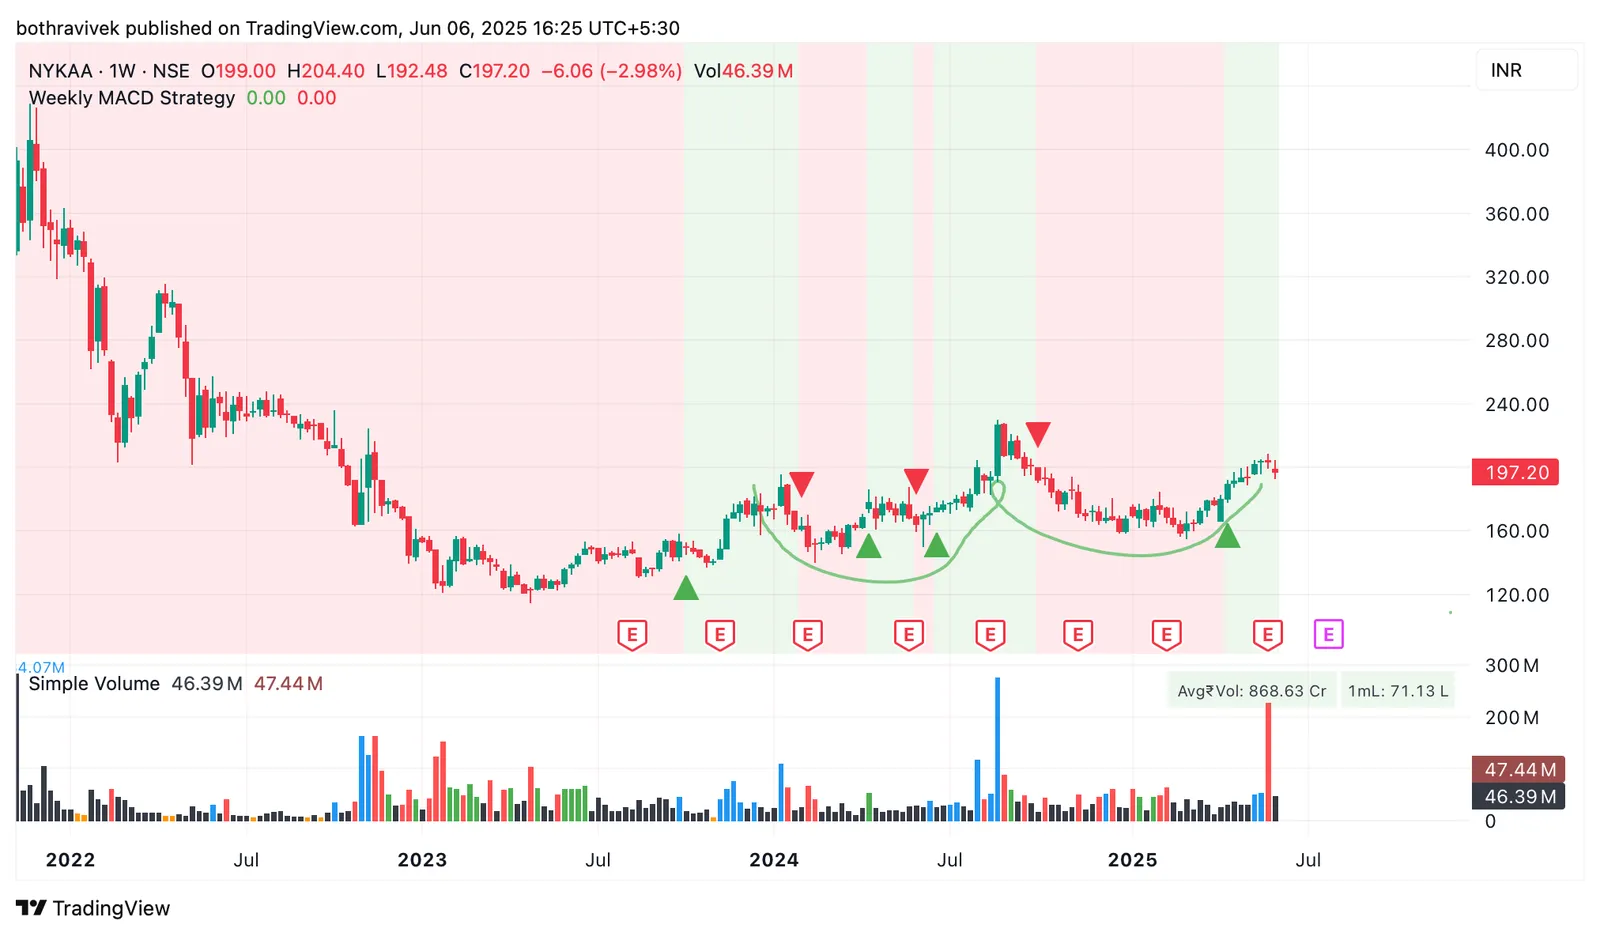
Another one, I expect this to hop in and hop out purely because it is making a basing pattern and also its in downturn in medium term
so unless we see blue and green volumes we may not see huge price movements
Hope this helps ask me if you have any questions
You can read the full article about this dashboard here
Related: Momentum Dashboard