Improvements

Written by 1 min read

The internet company’s trading indicator results have been really great, see below
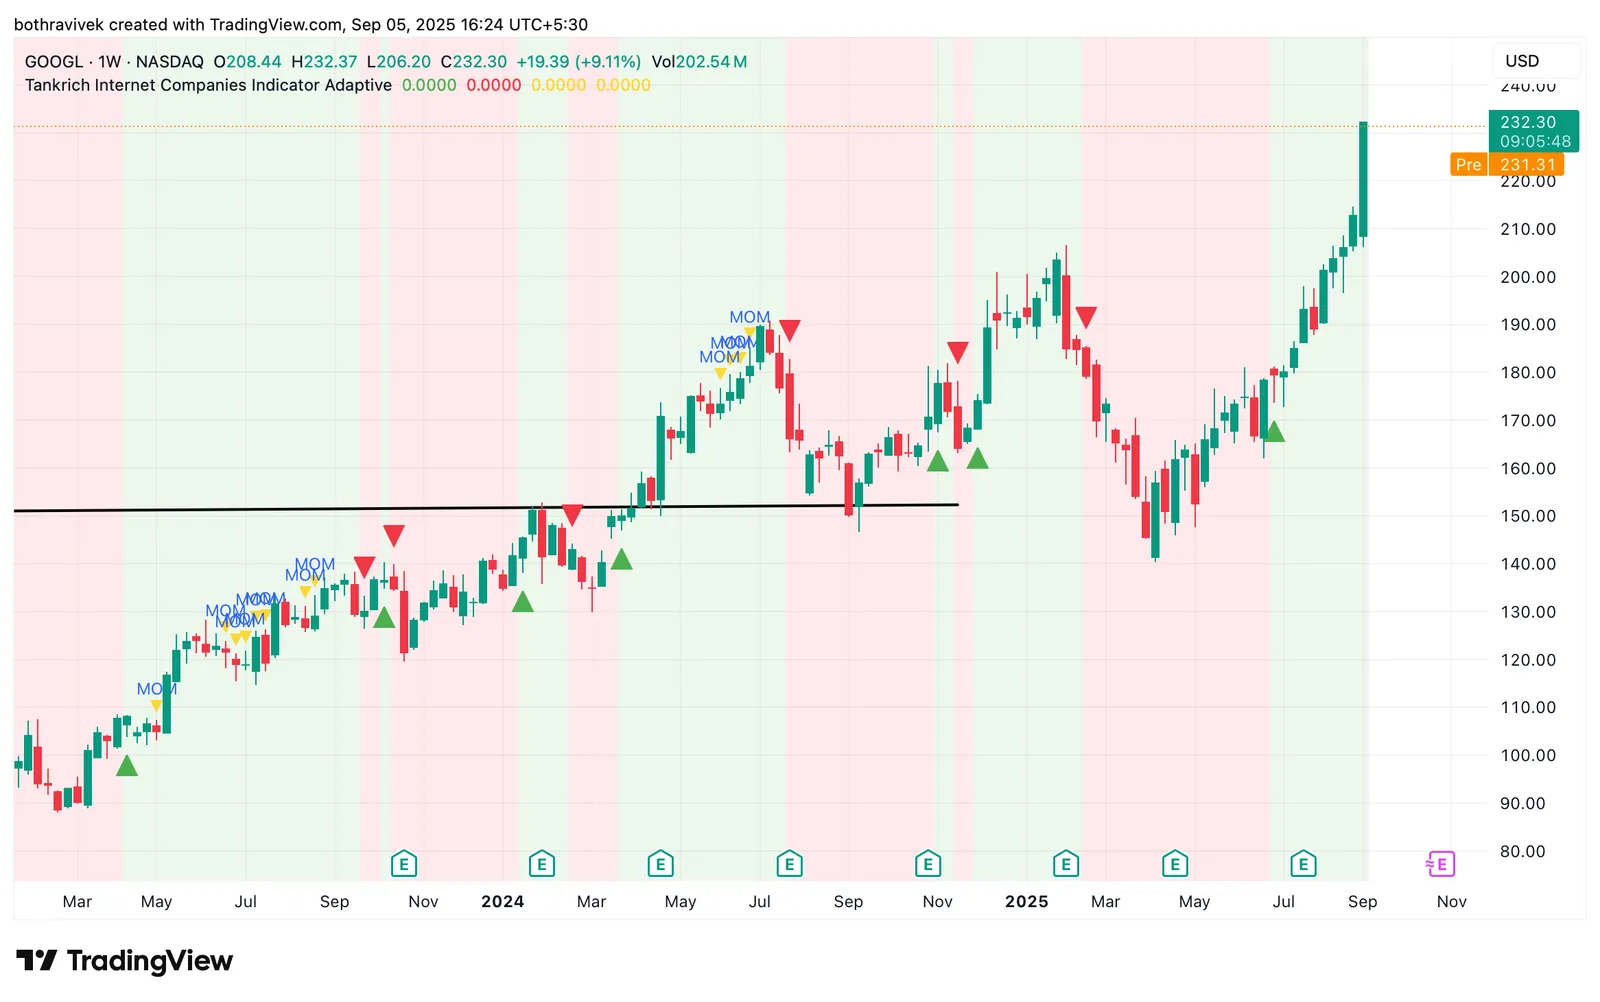
Google

Weekly Alphabet (GOOGL) chart, 2023 to Sep 2025, with the Tankrich Internet Companies Indicator's buy and sell triangles, MOM markers and shaded in and out zones

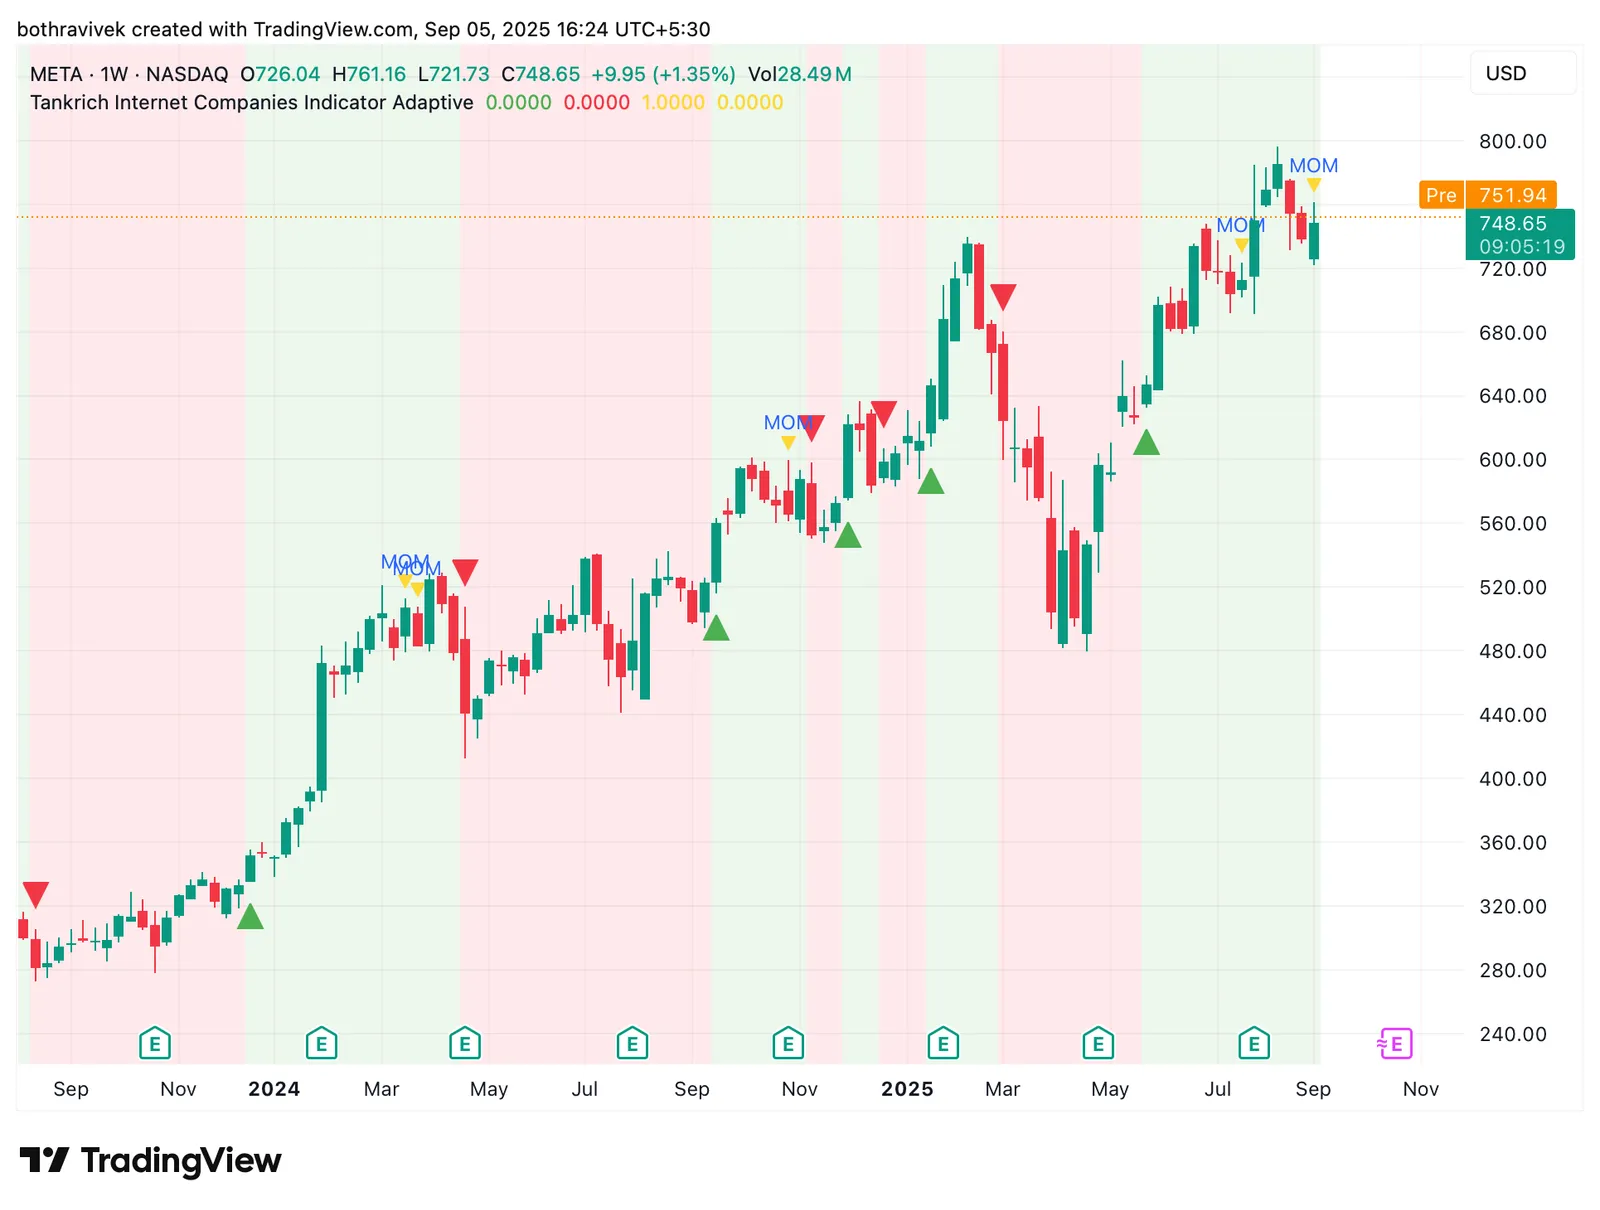
META

Weekly Meta chart, 2023 to Sep 2025, with the Tankrich Internet Companies Indicator signals as the stock rises from about $300 to $750

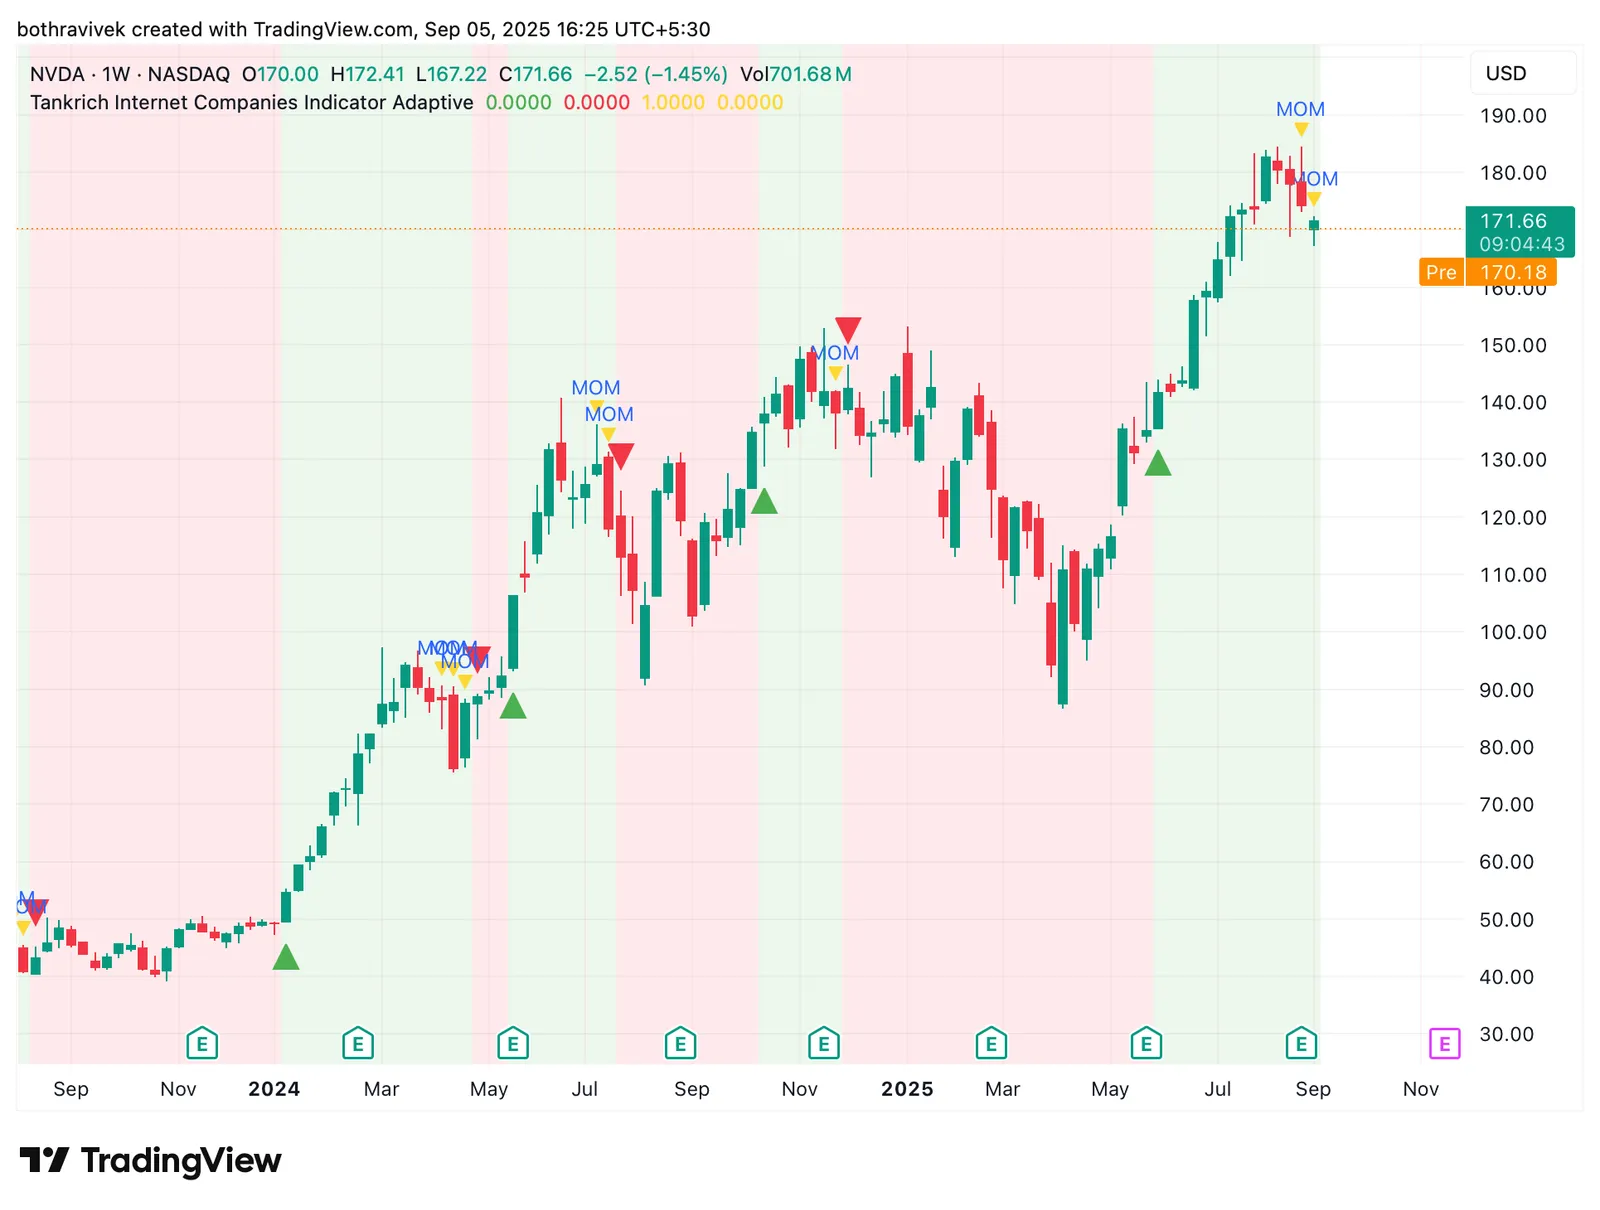
NVIDIA

Weekly Nvidia chart, 2023 to Sep 2025, with the Tankrich Internet Companies Indicator signals as the stock climbs from about $45 to $170

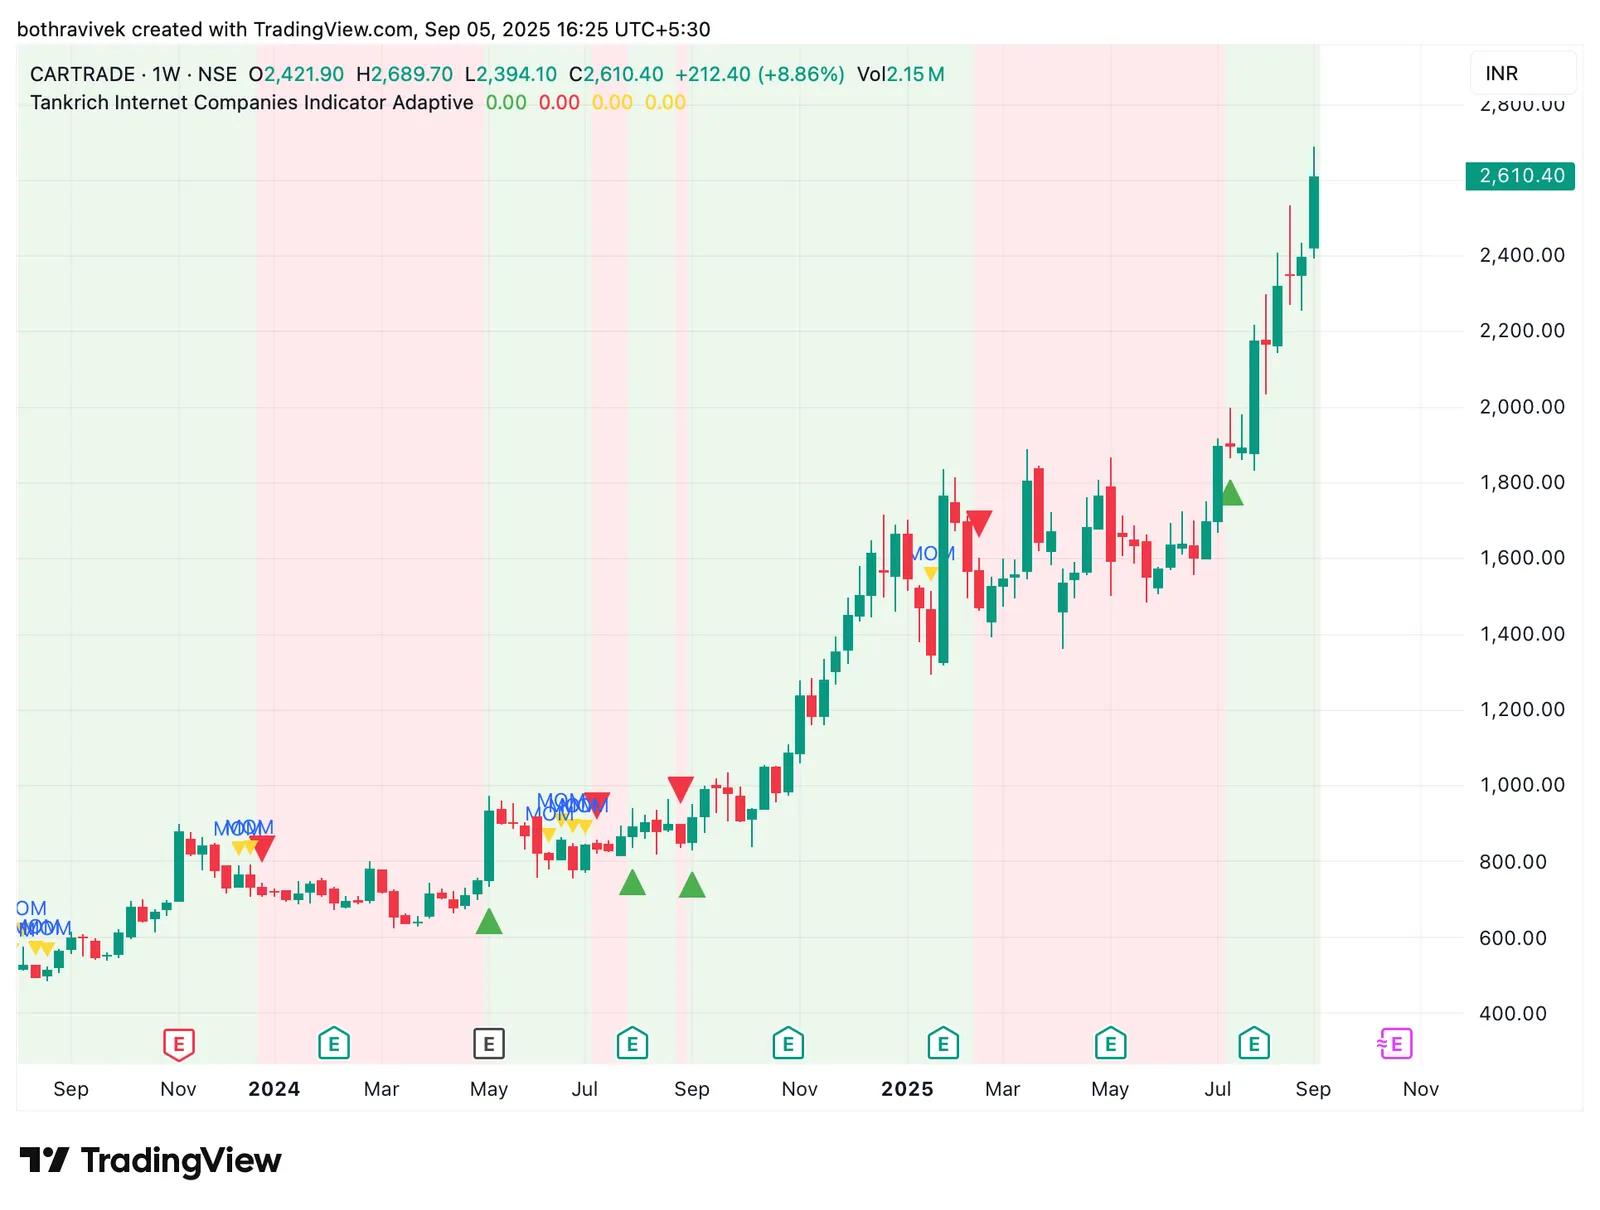
CARTRADE

Weekly CarTrade chart, 2023 to Sep 2025, with the Tankrich Internet Companies Indicator signals as the stock rises from about Rs 500 to Rs 2,610

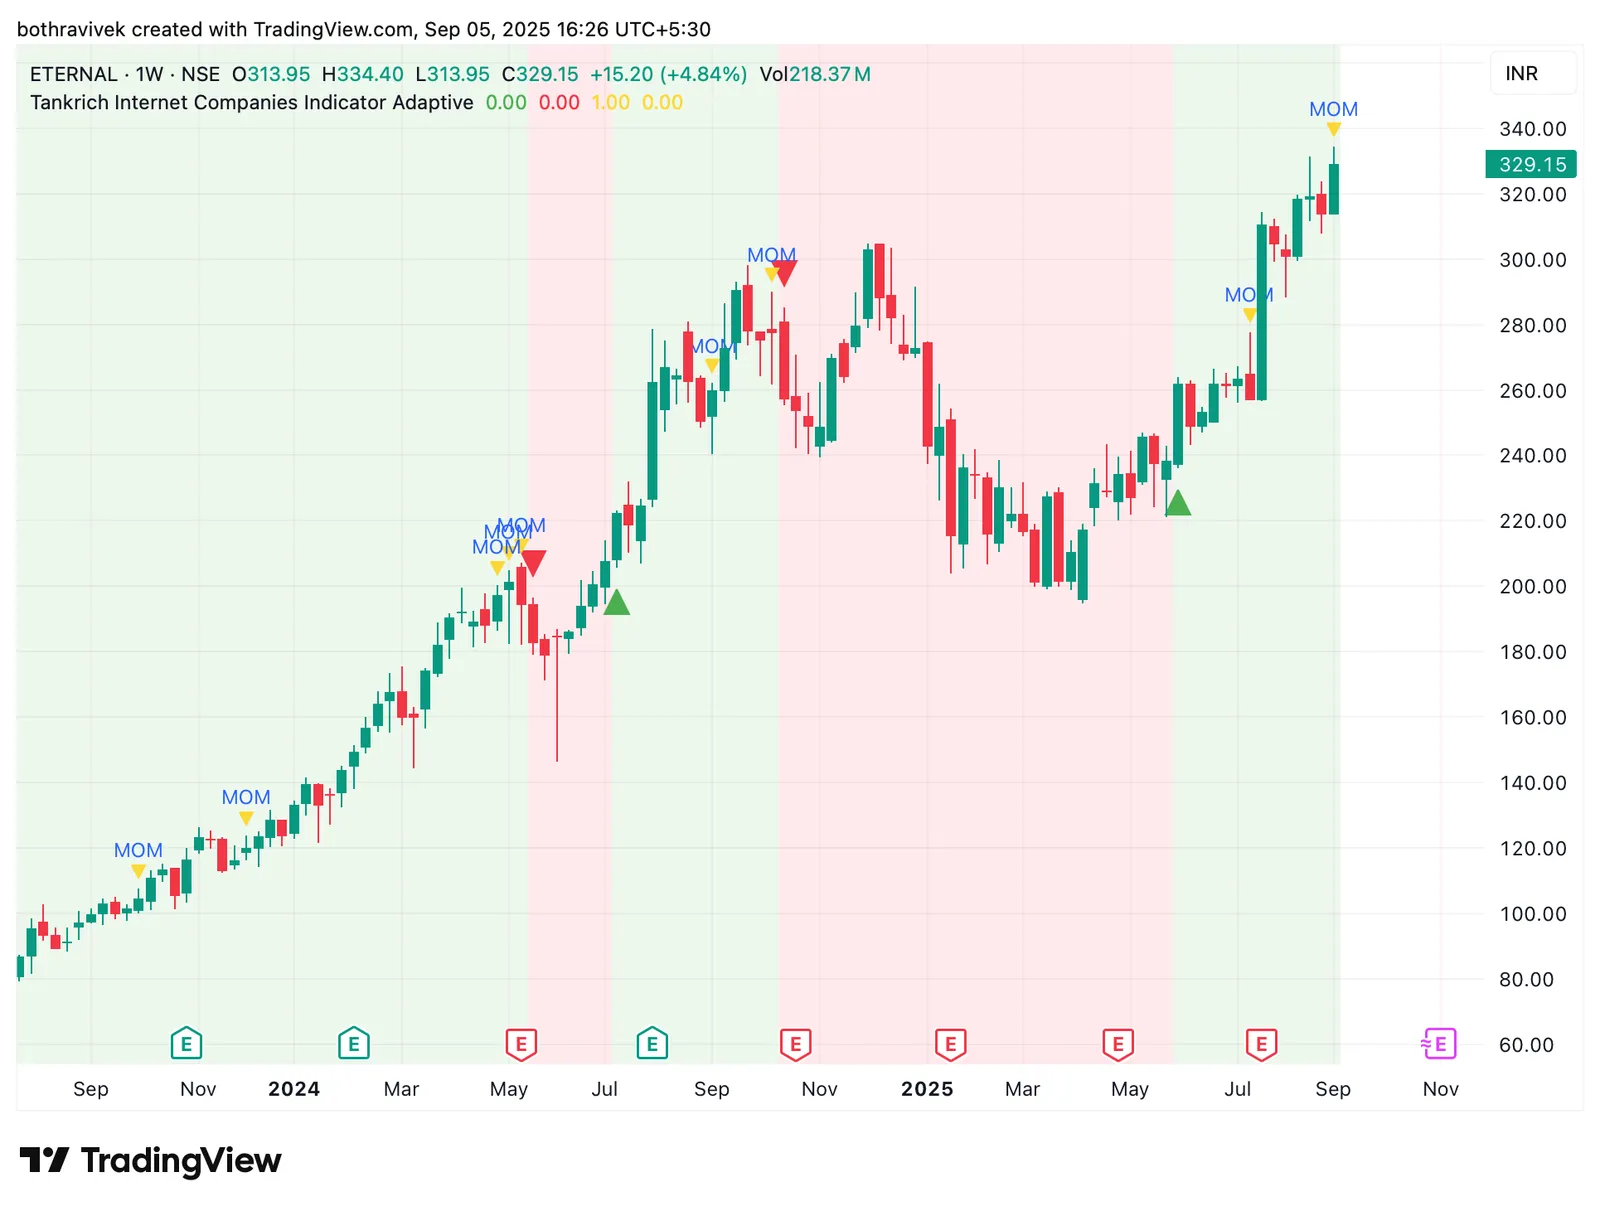
Zomato

Weekly Eternal (Zomato) chart, 2023 to Sep 2025, with the Tankrich Internet Companies Indicator signals and MOM markers as the stock rises to Rs 329

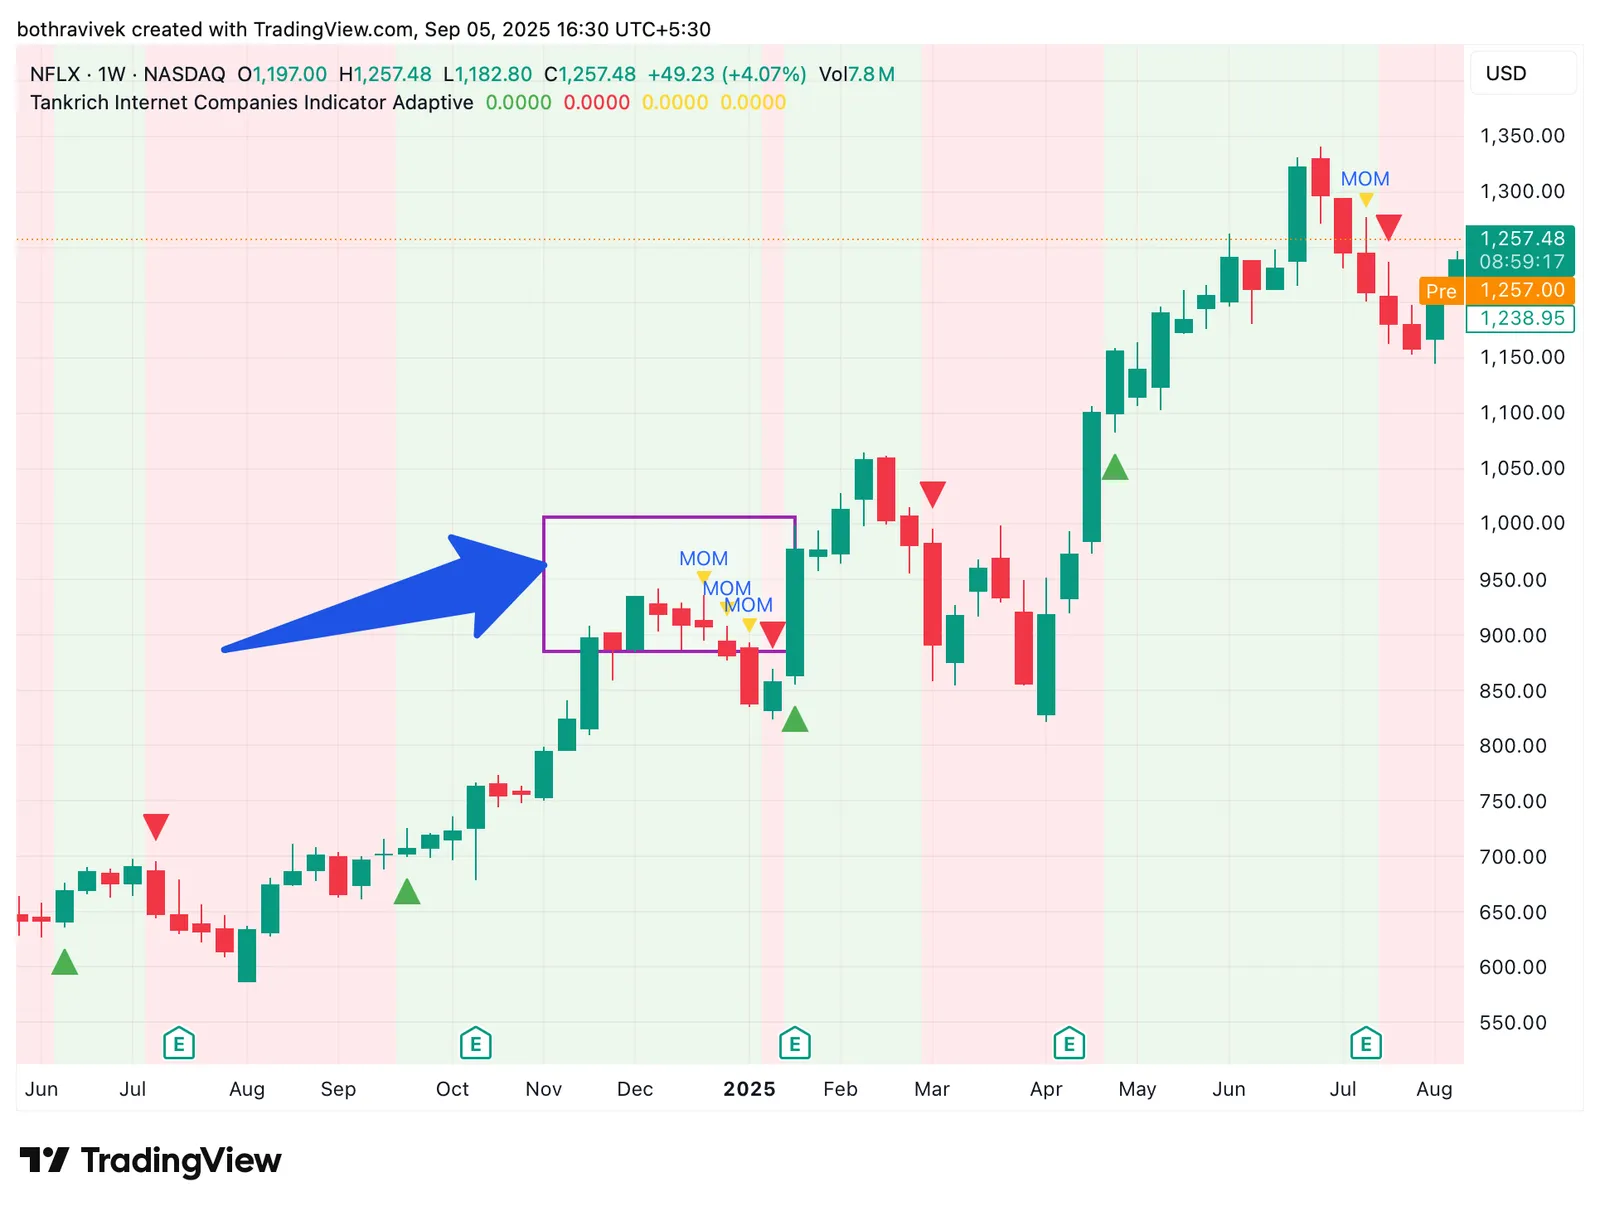
To improve profit take we are building MOM Fade, the yellow triangle not too loud, but nudging us that momentum is fading,

this indicator is built for weekly reviews so adding this small MOM fade can alert when to tighten your stop losses, see example below
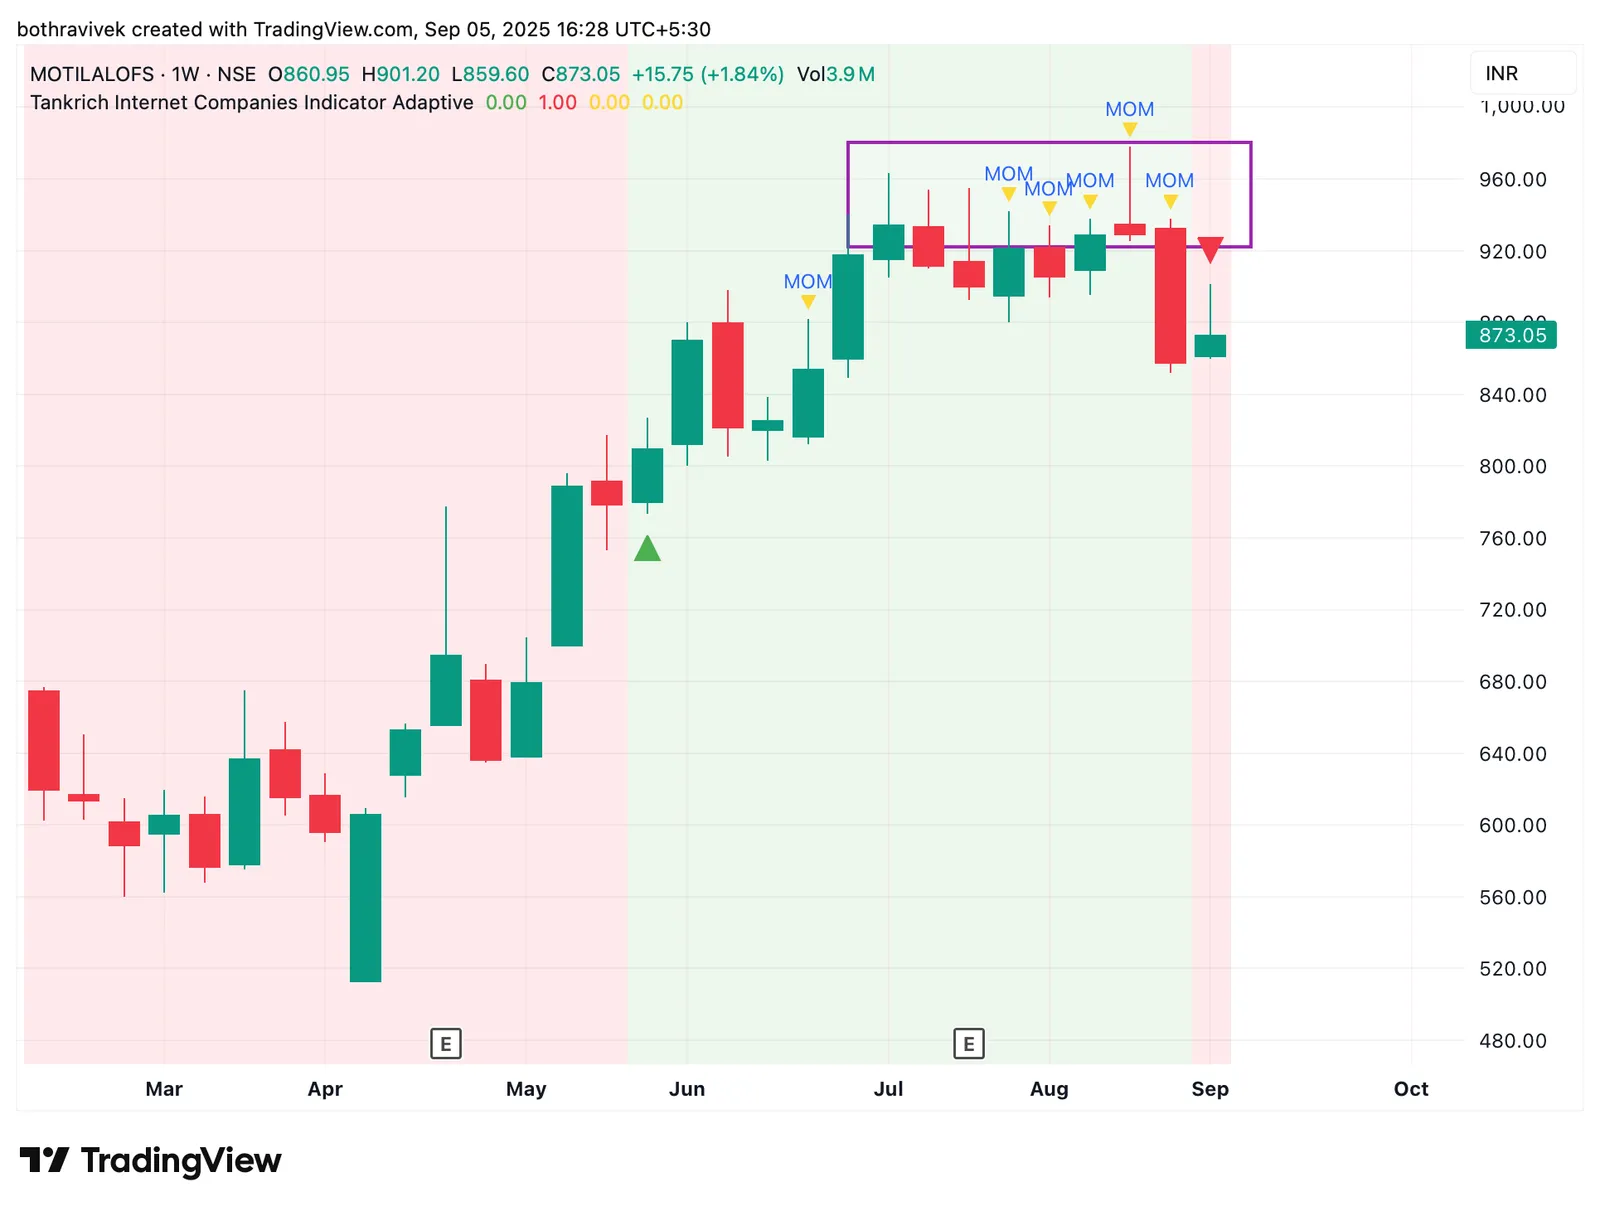
Weekly Motilal Oswal Financial chart, 2025, with a cluster of yellow MOM fade markers near the top flagging a time to tighten stops before the sell signal

See another example

Weekly Netflix chart, 2024 to 2025, with an arrow to MOM fade markers near $900 that appeared ahead of a sell signal and pullback

More improvements are on way, if you like to get add on this one check below

Keep reading

New writing, by email

Free posts arrive in your inbox. Paid subscribers read new research six months before it comes to this site.

Subscribe