The stair case companies
You have seen the humble staircase ?
Slowly step by step taking you to top

Investment world has some parallels
Some of the best companies when viewed on there long term charts they just look like staircase
Up > Flat > Up
See this example - KPR mills from 2008 to 2024
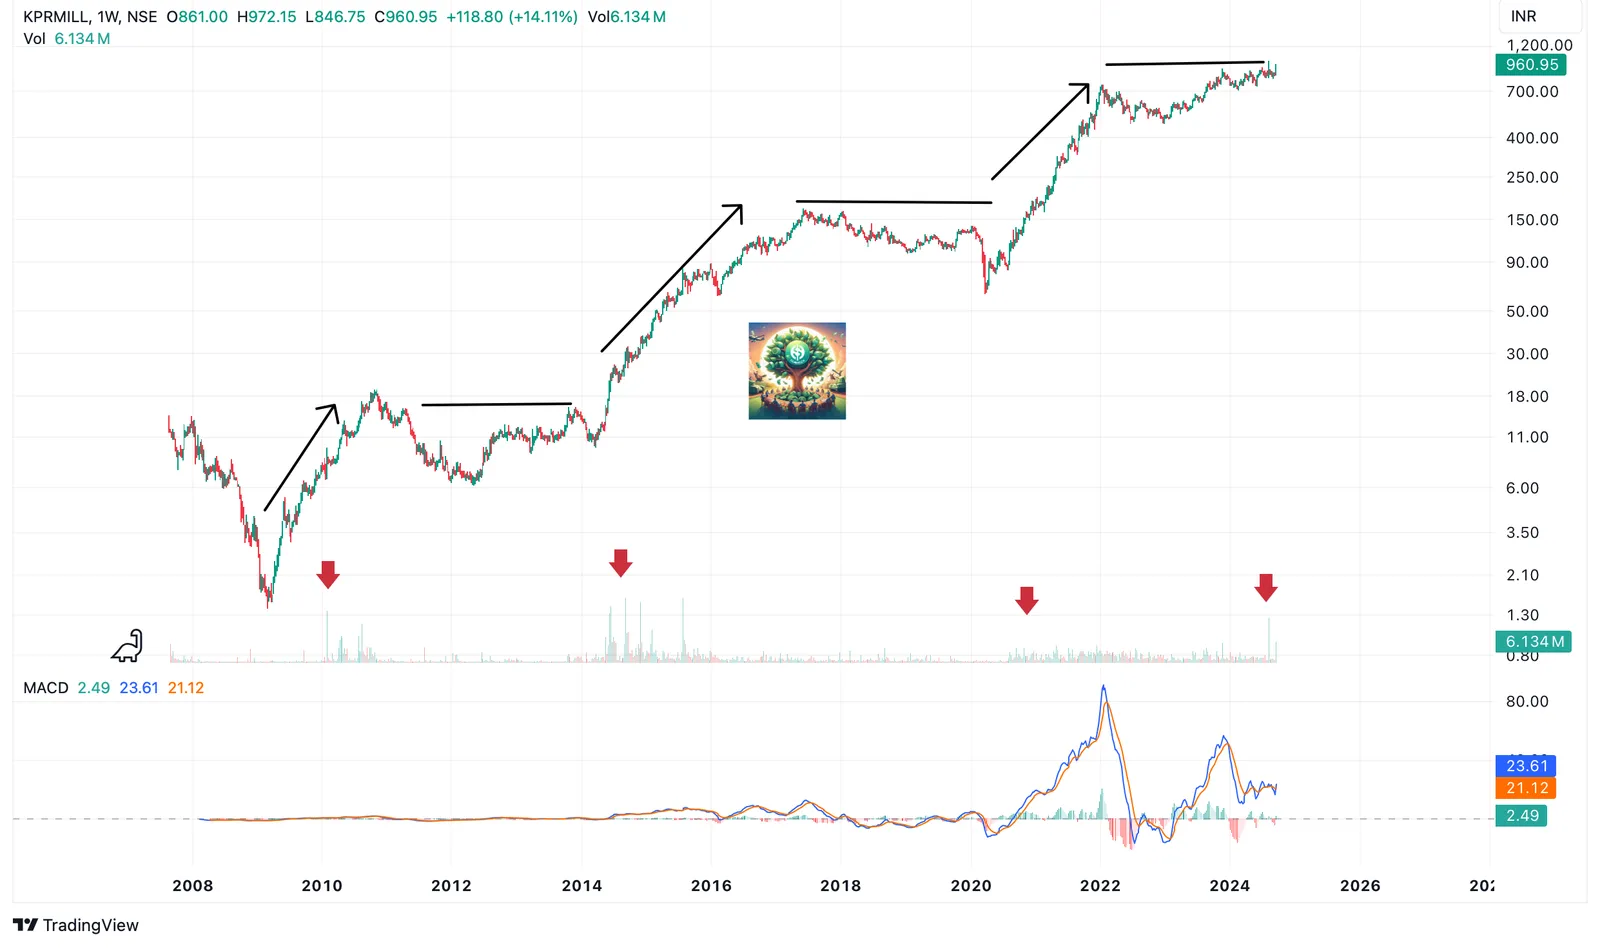
Companies that have authentic earnings power, go through these periods of consolidation before shooting up again.
The trading volumes are a give away, see in the above chart the red arrows are when volumes start shooting up followed by the price appreciation and during the consolidation phase the volumes are negligible or not material
Why this happens?
Pace of acceleration of earnings
For the same chart, I have added earnings acceleration now
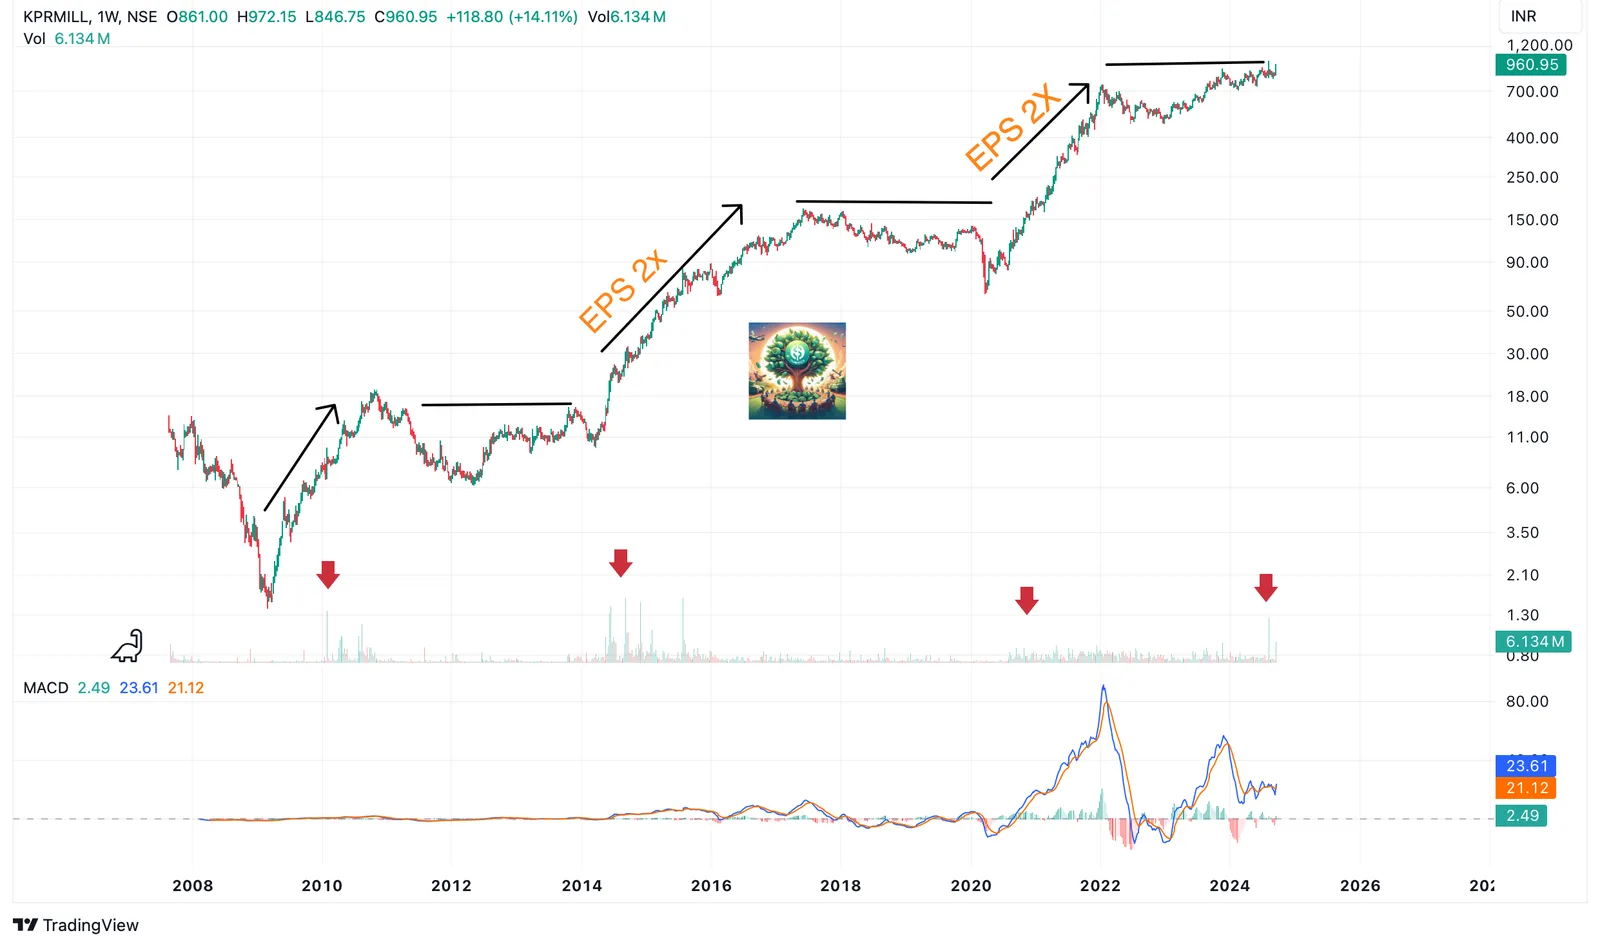
The earnings per share has been flat for last 2 to 3 years. When asked management pointed out that its due margin pressure in yarn and overall demand slowdown
especially yarn is facing a tough scenario. And margins used to be somewhere around 17%, 18%. Now it is somewhere around 10%, 12%. So the margin pressure is on the yarn front is causing reduction in the EBITDA percentage
Basically, the yarn demand need to be improved from thepresent level to next level. And the garment demand also has toimprove because we are being the large player we were able toget orders and to produce more number of garments.But the small garment players are facing problems. If you look at order position, sir, more or less 30%, 40% lesser than the normal.
read this good article that captures problems faced by spinning mills
It will be interesting to see how the demand situation plays, one way to get an early view of improving demand is gauge results and commentary from mostly pure play yarn players like Nitin Spinners or Sutlej textiles
I am tracking there execution and keeping a close eyes on textiles play
Happy Investing
I am going to end every post with something from gallery