The Map and the Territory
In the 1980s, a market technician named Stan Weinstein made a quiet, unglamorous claim: every stock, at every moment, is living in one of four seasons.
Not good stocks and bad stocks. Not cheap and expensive. Four seasons, turning over and over, forever.
There is Stage 1, the base —> when a stock is asleep. It drifts sideways. Volume dries up. Nobody at the dinner table mentions it.
Then Stage 2, the advance —> it wakes, and it climbs, and for a while the climbing feeds on itself.
Then Stage 3, the top —> it stalls and churns and looks tired in a way that’s hard to name.
And finally Stage 4, the decline —> it falls, and the falling also feeds on itself, and the people who loved it at the top sell it in despair at the bottom.
Weinstein’s real insight the question that makes you money is not “Is this a good company?” It’s “What season is it in?”
The seasons matter more than the stock.
I have believed this for years. And like everyone who believes something for years, I eventually decided I could improve on it.
The plan was to teach a computer to see the seasons for me.
So I built an indicator. It started simply: five conditions that, taken together, whispered that winter was ending a base tightening, volume returning, a trend turning up. Stage 1 becoming Stage 2, written in code.
It worked, sort of. So I did what we all do. I added.
I added a regime filter only buy when the price is above a rising long-term average. I was proud of it. It took me an embarrassingly long time to notice that I had simply written, in a more complicated hand, “only buy in Stage 2.”
Then I added relative strength only buy the stocks beating the broad market, the real leaders. Elegant. Also: exactly the relative-strength line Weinstein told people to draw, by hand, on graph paper, decades earlier.
Then I added exits sell when the trend cracks. Which is, of course, “sell when Stage 2 ends.”
Here is the thing I did not expect. Every single improvement I made to the map turned out to be already on the map. I hadn’t expanded Weinstein’s idea. I had only redrawn it in a language a machine could read. The forty-year-old framework did not need my code.
My code needed the framework.
What the indicator did give me was something subtler, and more useful than new answers. It gave me a witness. It stood between me and my own talent for self-deception, and on four stocks it caught me or vindicated me with the same lesson each time.
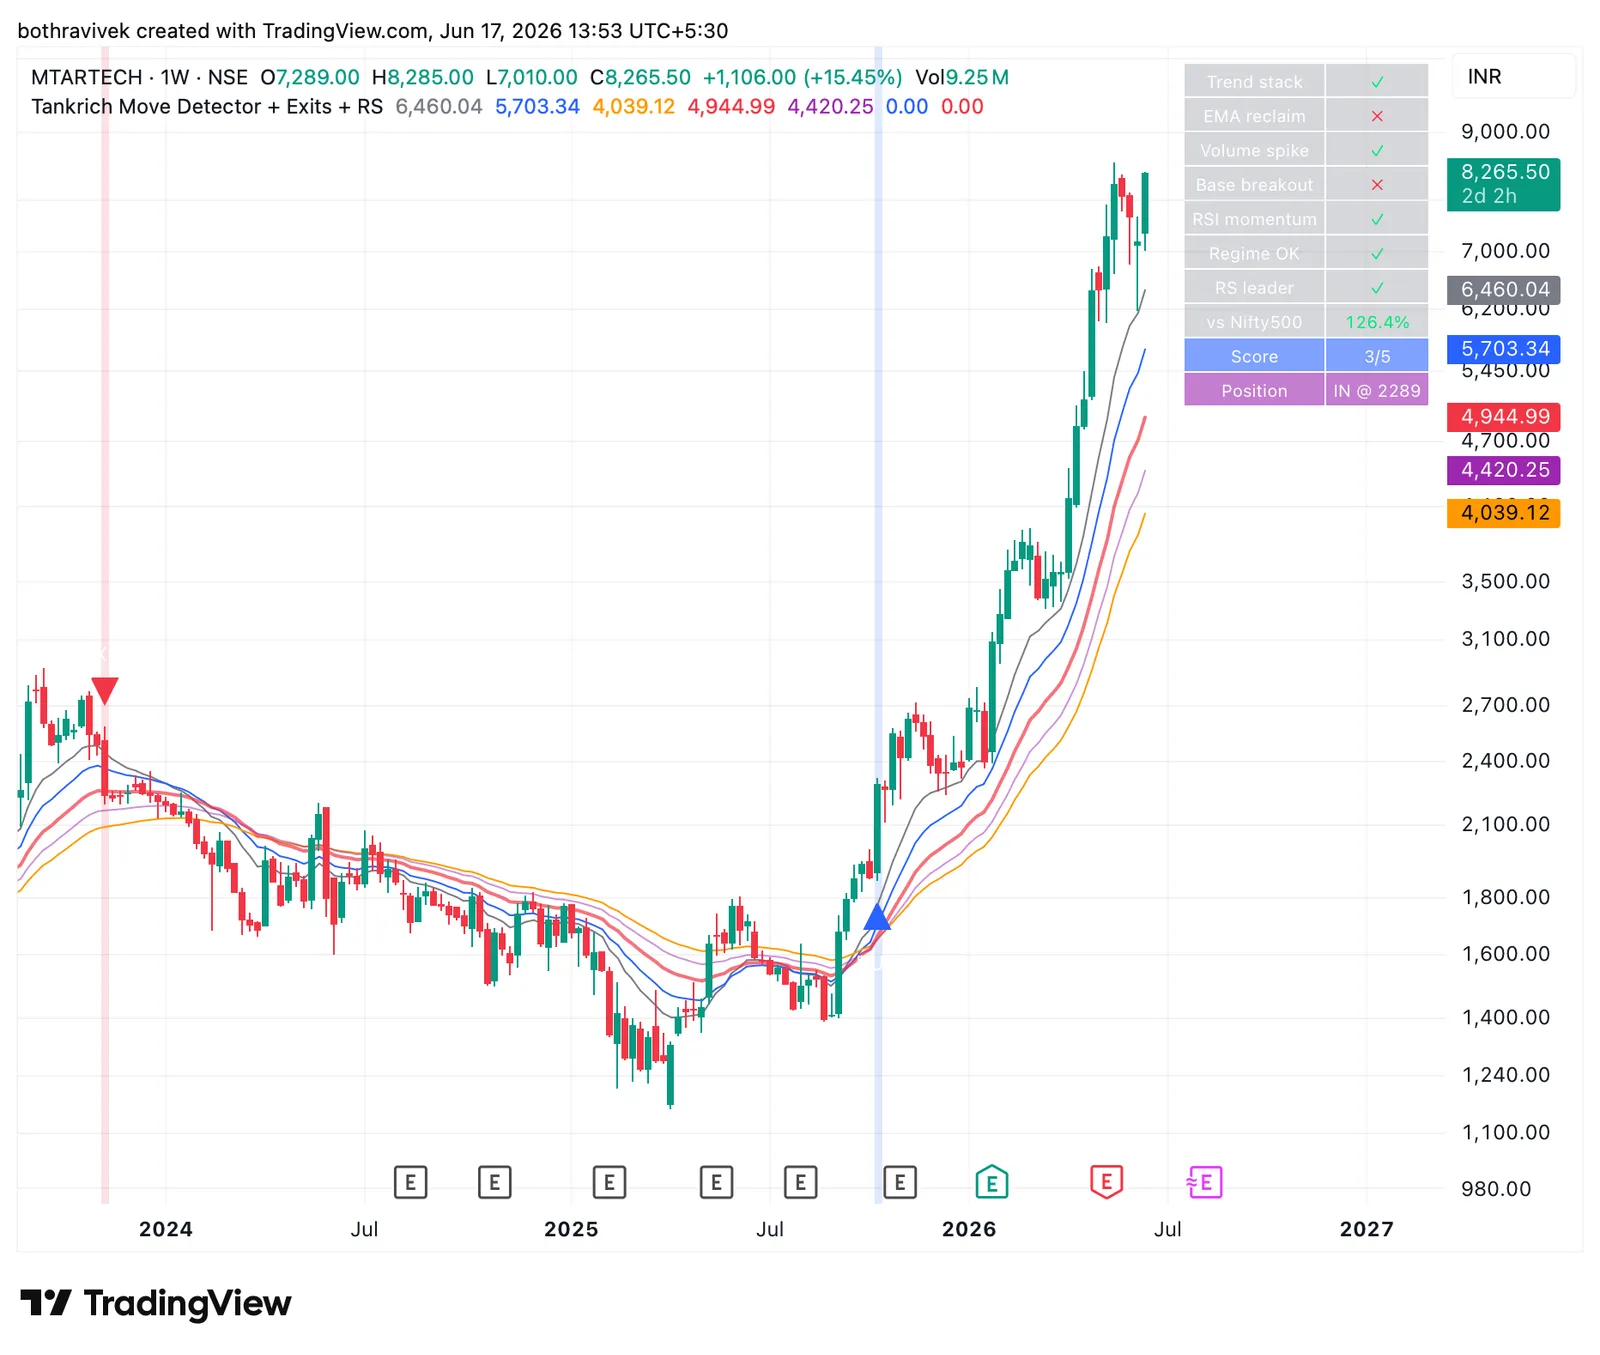
There was MTAR, which I let the system buy in the middle of a long decline because the chart, in that one moment, looked tempting. Stage 4. It fell further, exactly as it should have. The map had a word for that season. I had chosen not to read it.
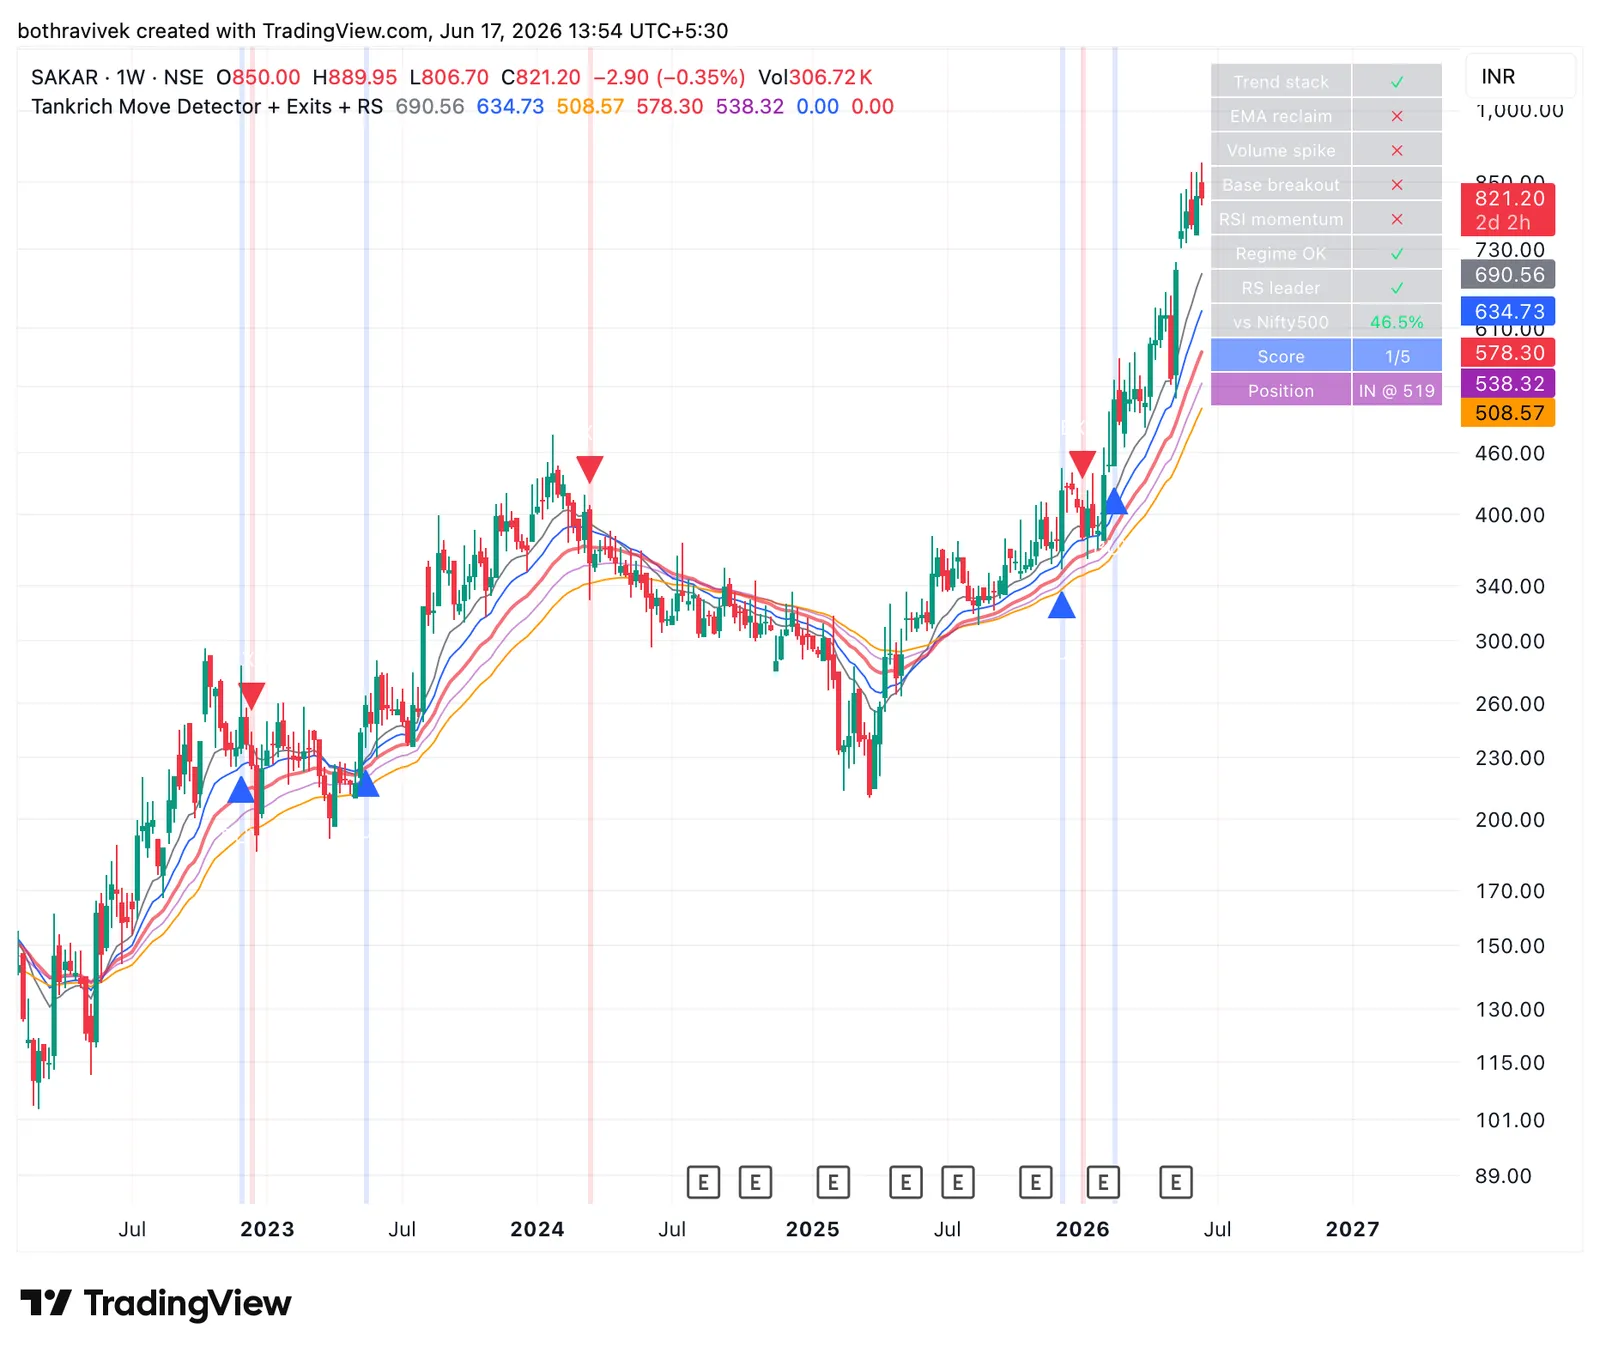
There was SAKAR, which stair-stepped upward for six years climb, rest, climb, rest. Stage 2, again and again and again. It asked for nothing but patience and paid for it handsomely. The map’s reward, collected on time.
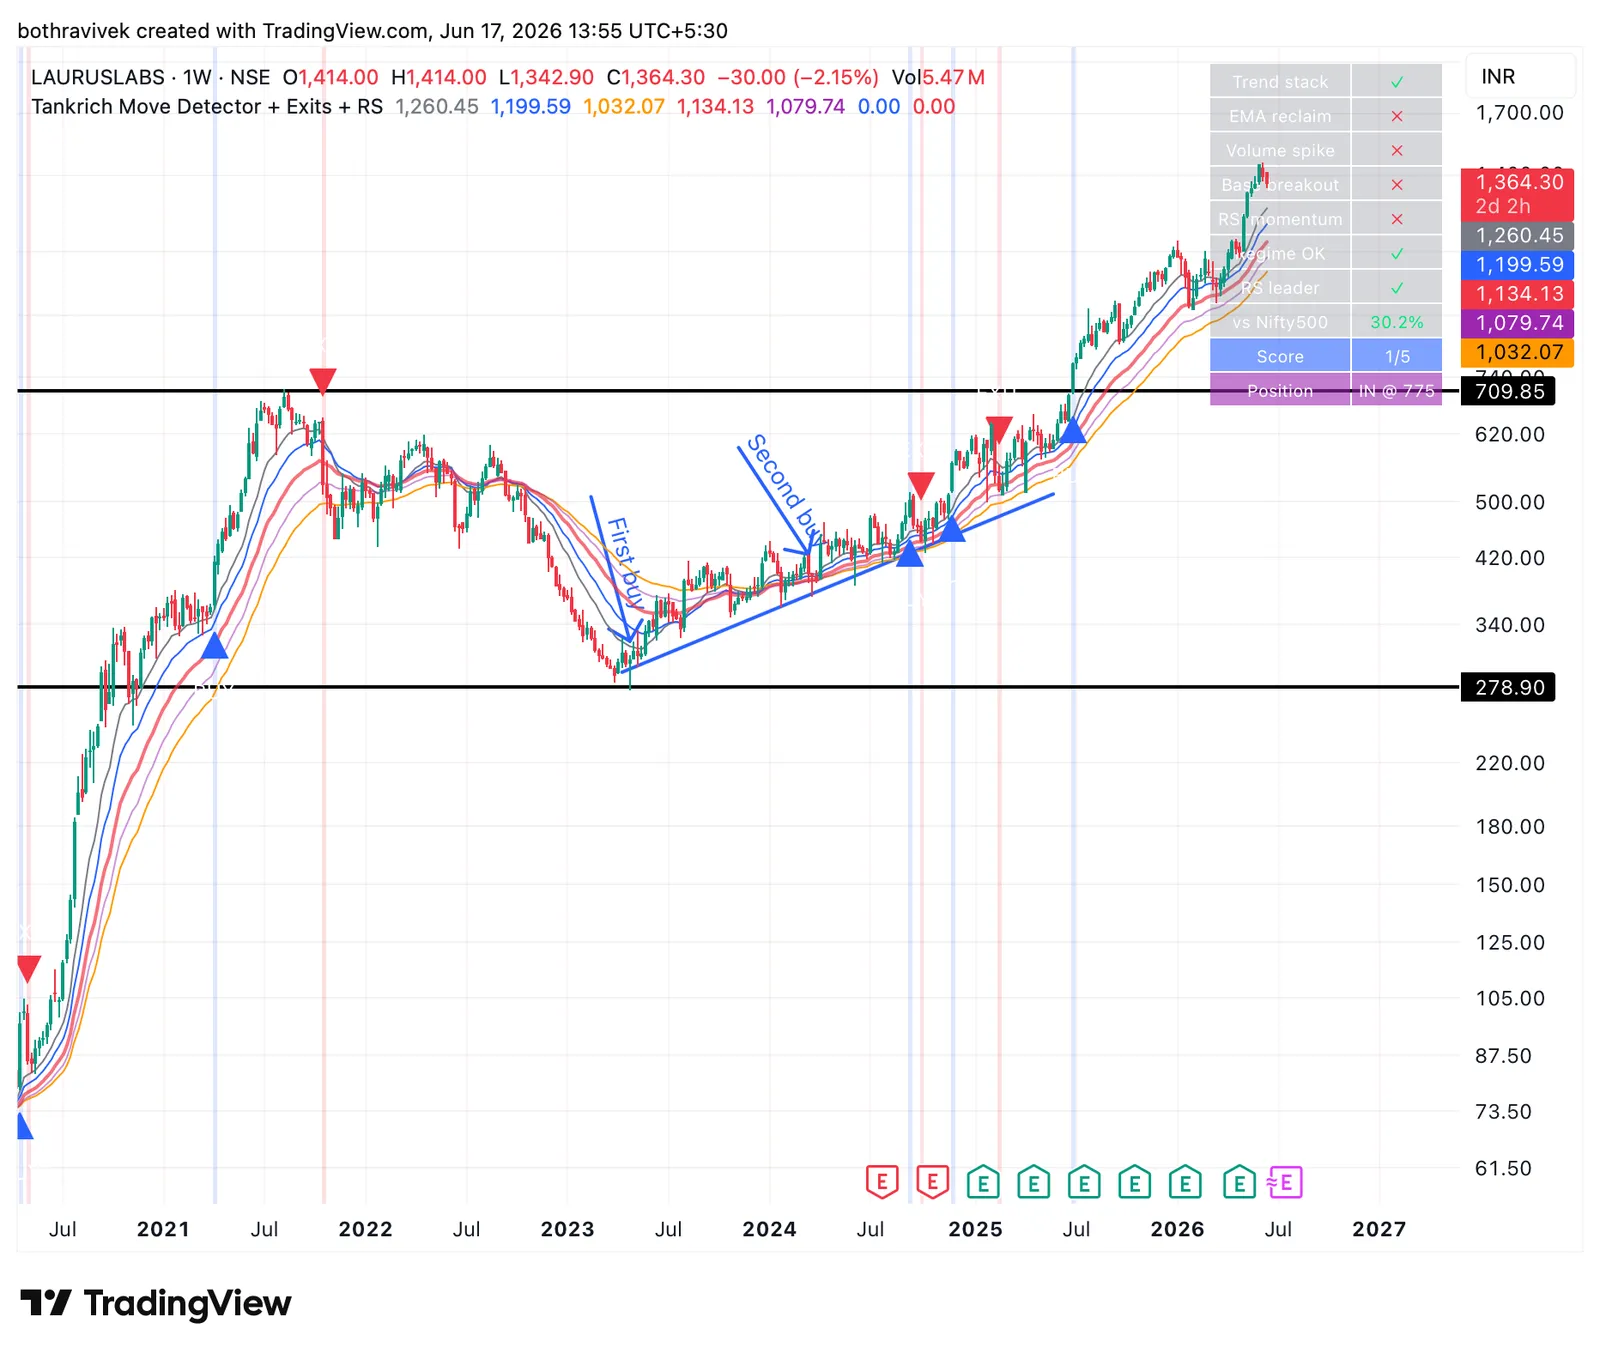
There was LAURUS, which spent two years and a sixty-percent fall grinding through Stage 4, then based, then broke out to new all-time highs. The purest Stage 2 there is because above an all-time high nobody is trapped, nobody is waiting to sell into strength, and the path of least resistance is simply up.
Three stocks. Three seasons. One lesson, restated three times in a row. The computer had not found new truths. It had found the same truth and, the part that matters, it left me no room to argue with it. A chart you read by feel will always let you rationalize. A condition that prints red or green will not.
A good model does not give you answers. It takes away your excuses.
And then there was CUPID.
CUPID went up more than a ten fold. The indicator never bought it. Not once.
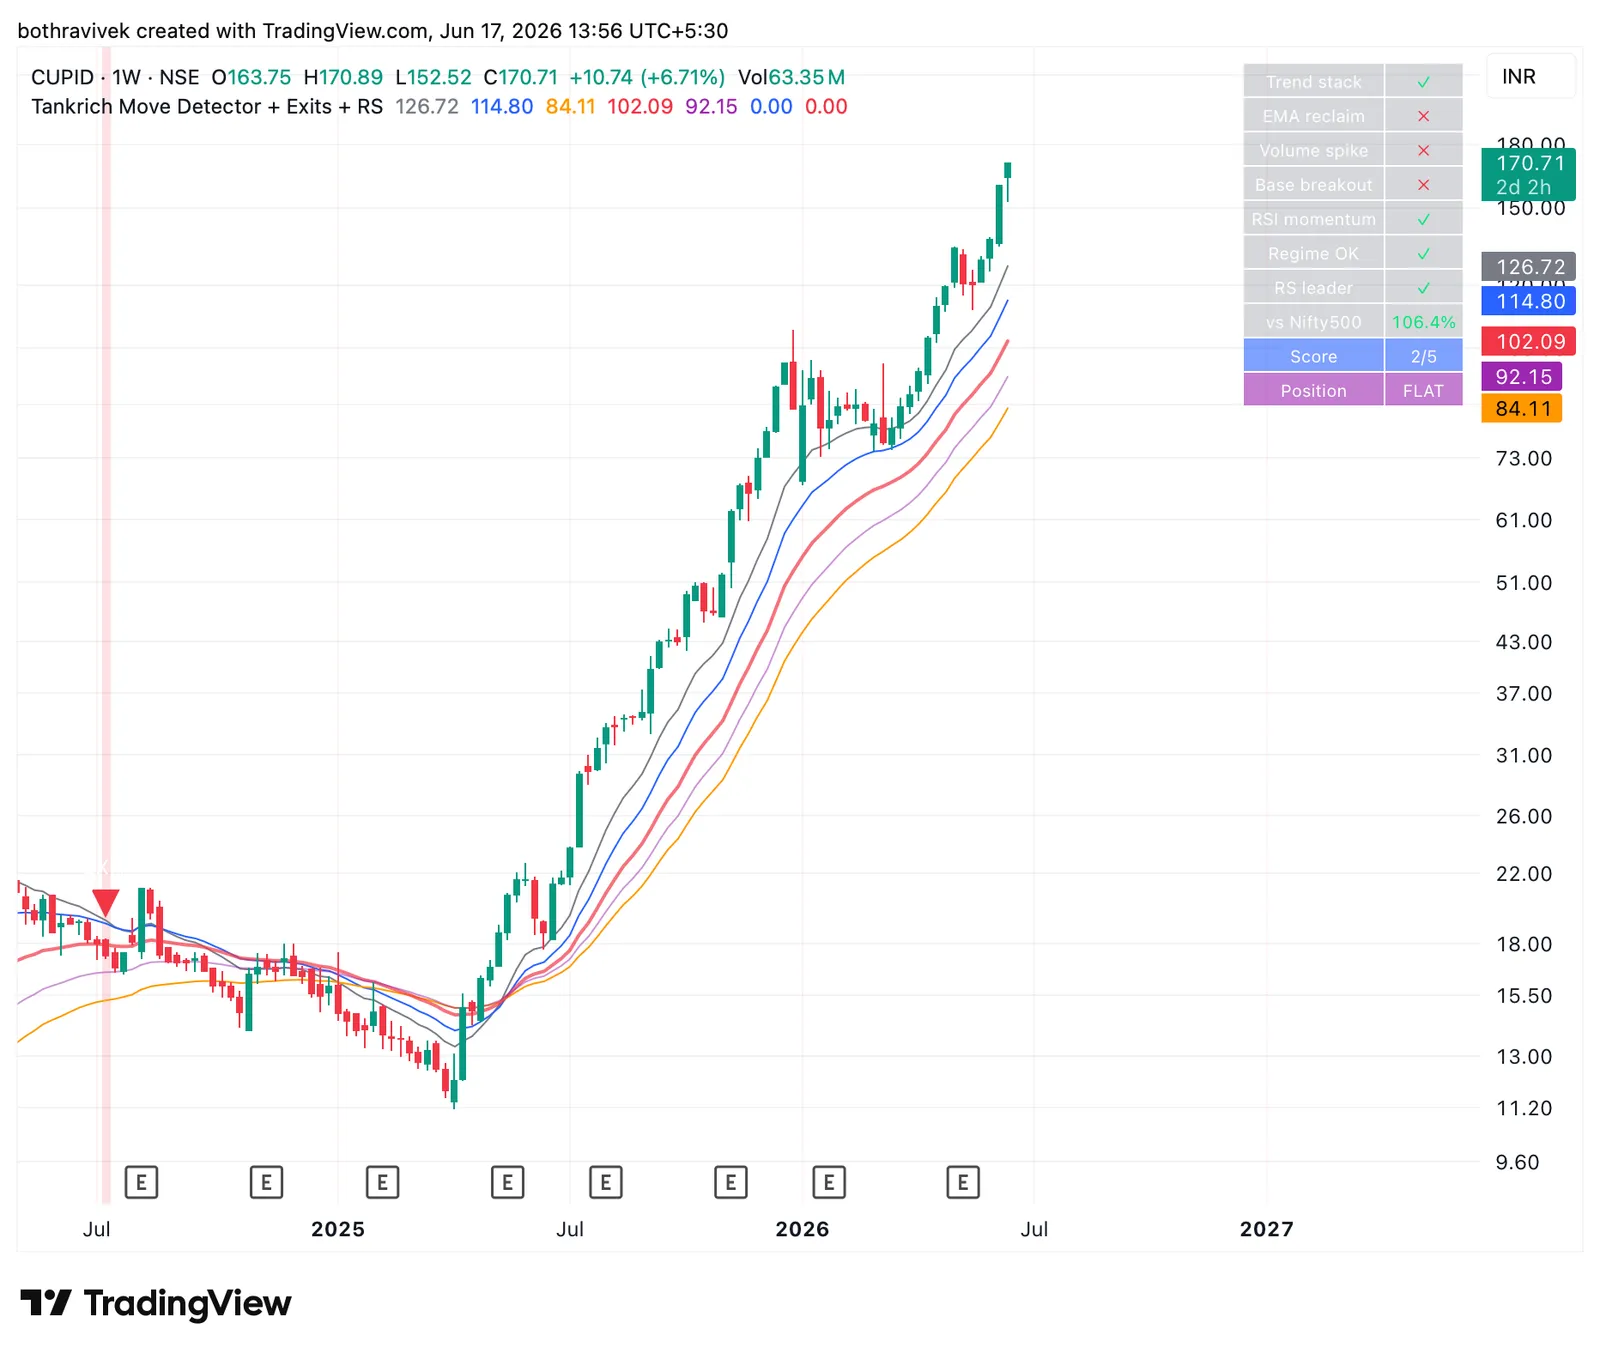
For four years it coiled at the very bottom a base so long then it went vertical. Straight up, faster than any confirmation could keep pace with. By the time my careful filters agreed it was a leader, it had already become one, ten times over. The dashboard lit up green yes, a winner! while the position sat empty. The map had quietly run out of paper.
For a day this annoyed me. Then it became the most honest thing the tool ever did.
Because every map has territory it does not cover. Weinstein’s four seasons describe the orderly life of an ordinary stock beautifully and CUPID was not ordinary, and its life was not orderly. The failure was never that the indicator missed the move. The failure would have been a tool so desperate to catch it that it also caught the hundred lookalikes that coiled exactly the same way and then died in the dark. Selectivity is not a bug. The price of staying out of a hundred traps is waving goodbye to the occasional rocket.
Charlie Munger spent his life arguing that knowing the edge of your competence is worth more than being clever inside it. CUPID was my indicator telling me, in the only language it had, here is where I stop knowing things.
So did the indicator expand the four-stage framework?
Not the way I set out to. It added no new season, no secret fifth box, no hidden truth Weinstein missed. In that sense it expanded nothing at all.
But it expanded what the framework could do. It turned a map you read into a map that reads you back one that catches you the instant you are about to lie to yourself about which season you are in. And it did the rarest thing any model can do: it showed me, clearly and without flattery, precisely where it stops working.
The map is not the territory. It never was. A century ago Alfred Korzybski gave us that line, and Munger spent decades making sure investors could not forget it. The best map does not pretend to be the ground. It only keeps you honest about where you are standing and tells you, plainly, when you have walked off its edge.
Weinstein drew the map by hand.
All I did was teach it to whisper back.